

Question: Please provide a step by step calculation with excel, and please explain the interpretation of the number. Thank you b. Consider the following sales forecast
Please provide a step by step calculation with excel, and please explain the interpretation of the number.
Thank you
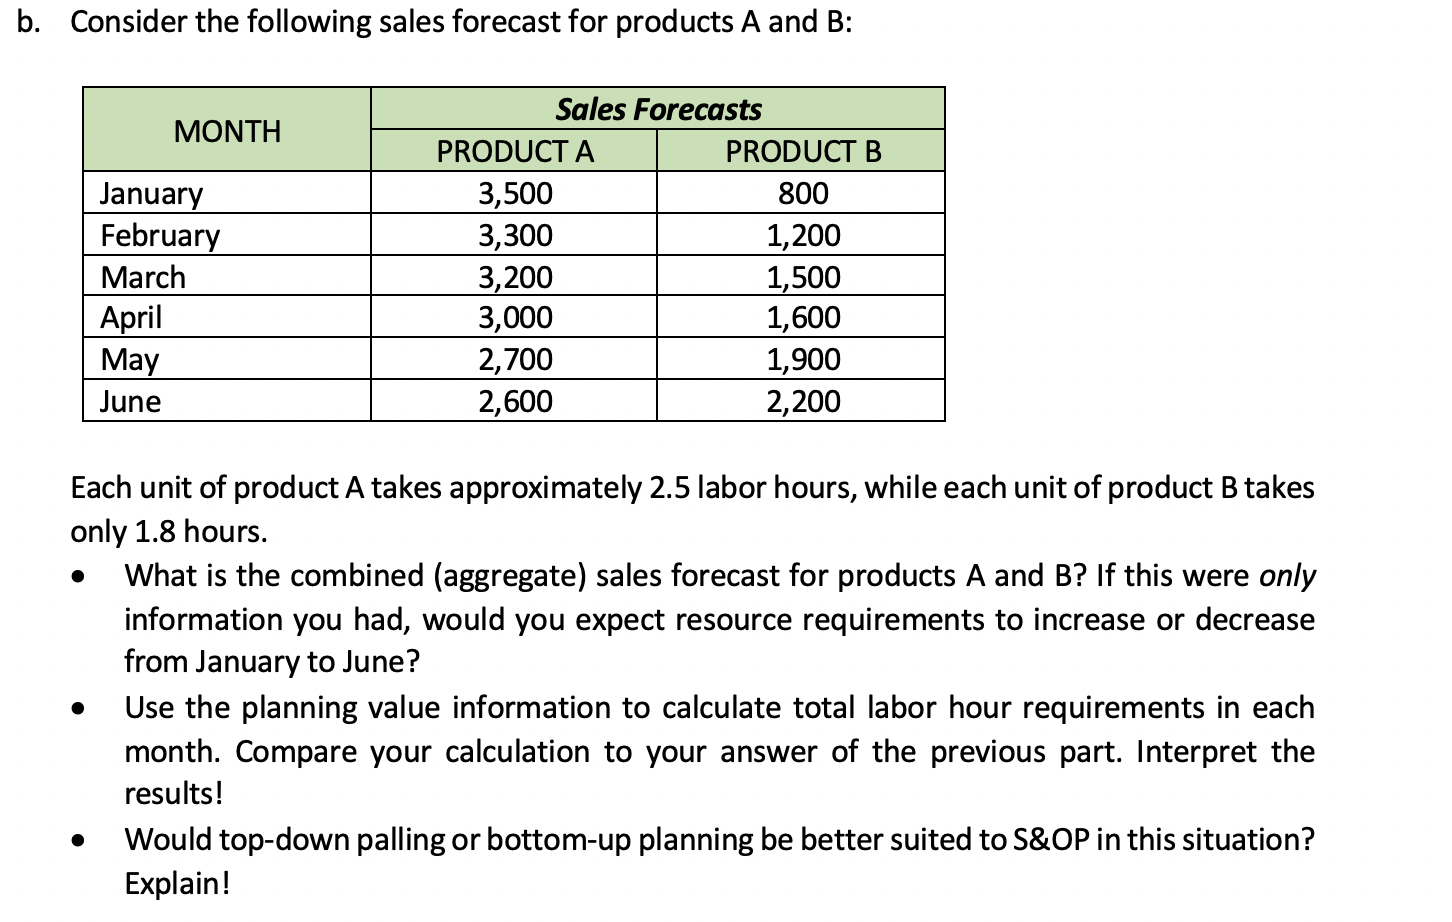
b. Consider the following sales forecast for products A and B: MONTH January February March April May June Sales Forecasts PRODUCT A PRODUCT B 3,500 800 3,300 1,200 3,200 1,500 3,000 1,600 2,700 1,900 2,600 2,200 . Each unit of product A takes approximately 2.5 labor hours, while each unit of product B takes only 1.8 hours. What is the combined (aggregate) sales forecast for products A and B? If this were only information you had, would you expect resource requirements to increase or decrease from January to June? Use the planning value information to calculate total labor hour requirements in each month. Compare your calculation to your answer of the previous part. Interpret the results! Would top-down palling or bottom-up planning be better suited to S&OP in this situation? ExplainStep by Step Solution
There are 3 Steps involved in it
1 Expert Approved Answer
Step: 1 Unlock

Question Has Been Solved by an Expert!
Get step-by-step solutions from verified subject matter experts
Step: 2 Unlock
Step: 3 Unlock