

Question: Please provide a summary of the case study and answer the question below: Question: 3. Management Compensation and Director Independence n. Examine the remuneration information
Please provide a summary of the case study and answer the question below:
Question:
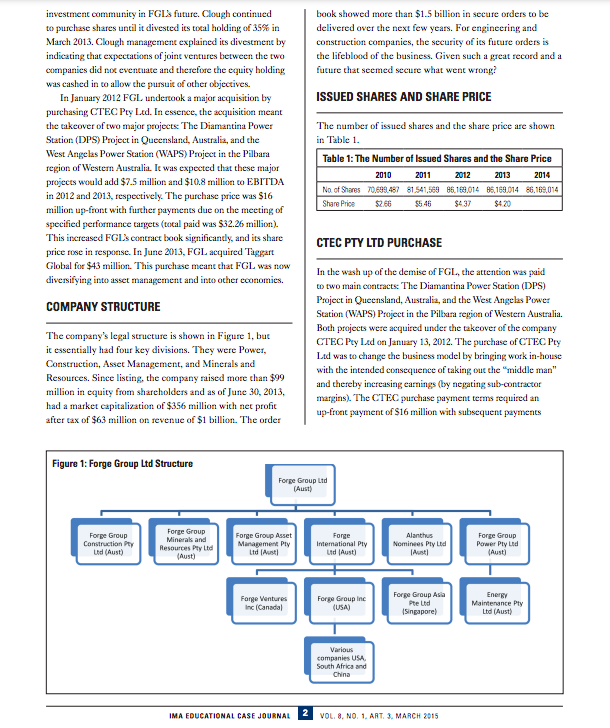
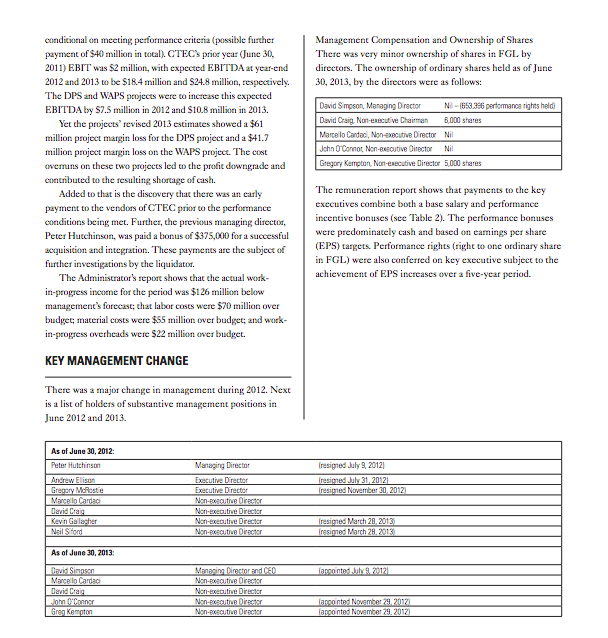
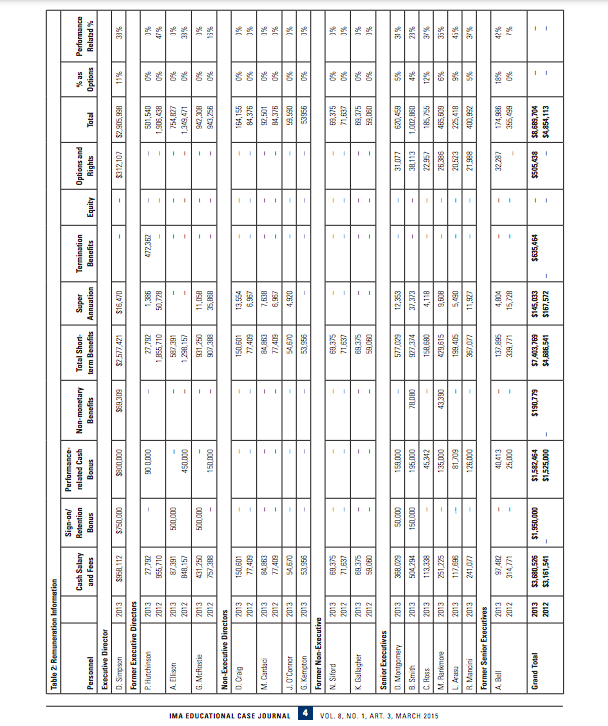
3. Management Compensation and Director Independence n. Examine the remuneration information of FGL's board of directors and key management personnel. Using this information, draw some conclusions as to the actions of directors and key personnel. b. Explain director independence. In your view, appraise the independence of the FGL director. Evaluate whether this was in FGL's best interest.IMA The Association of EDUCATIONAL Case ima Accountants and Financial Professionals Case Journal Study in Business SSN 1940-204X Forge Group Lid Case Study (B) Director Duties, Management Compensation and Ownership, Risk, and Ethics Suzanne Maloney University of Southern Queensland Toowoomba, Australia, 4350. Suzy MaloneyCusq edu.au THE FORGE STORY all tendering and quoting on various stages of work in a project. This makes the industry highly competitive, and the value of Forge Group Led (FGL) was a successful engineering appropriate costing and project management expertise is vital. and construction company based in Australia, listed on After the Global Financial Crisis (GFC), large-scale the Australia Stock Exchange with 2,000 employees and mining and construction projects had been the driving force operating across eight countries. On March 6, 2013, its share for some economies, especially in Australia. But recently price peaked at $6.98. (All monetary amounts discussed there has been a decrease in activity in this area because a herein are in Australian dollars. To convert to another number of projects were completed and moved to production currency, visit www.x-rates.com.) It was on a growth path phase. In Australia in 2013-2014, the engineering and and had $1.5 billion in forward orders on its books. Within 12 construction spend was $128 billion, dropping $1 billion from months, it was out of business. Voluntary administrators and the previous year. This decline increases competition in the receivers were appointed in February 2014. sector and therefore demand for lower-priced contracts and shorter completion times. The market value of a company is THE ENGINEERING AND CONSTRUCTION based partly on its future secured order book. The sector is INDUSTRY risky, and many companies have suffered as a result of stalled projects, poor costing, and mismanaged cash flow. The engineering and construction sector provides significant economic activity in many countries. The industry is typically THE FORGE GROUP LTD STORY seen as high risk due to the nature and size of the contracts. The contracts typically span long periods of time, which adds The company was formed from a private construction company tremendous uncertainty given the forecasting required and large called AiConstruction and listed on the Australian Stock amounts of capital involved. Joint ventures and public/private Exchange at $0.56 on June 26, 2007. The company's path was partnerships are common in the industry to reduce the risk of one of acquisitions and organic growth since it survived the large-scale projects and to ensure adequate capital and expertise. GFC and leveraged the mining and construction boom. In April Major contracts generally involve a number of different 2010, another construction company called Clough bought 13% companies with primary contractor and sub-contractor status, (10.5 million shares) of the FGL ordinary shares, thus becoming the largest shareholder. This sent a confident message to the IMA EDUCATIONAL CASE JOURNAL 1 VOL. 8, NO. 1. ART. 3. MARCH 2015 92015 IMAinvestment community in FGI's future. Clough continued book showed more than $1.5 billion in secure orders to be to purchase shares until it divested its total holding of 35% in delivered over the next few years. For engineering and March 2013. Clough management explained its divestment by construction companies, the security of its future orders is indicating that expectations of joint ventures between the two the lifeblood of the business. Given such a great record and a companies did not eventuate and therefore the equity holding focure that seemed secure what went wrong? was cashed in to allow the pursuit of other objectives. In January 2012 FGL undertook a major acquisition by ISSUED SHARES AND SHARE PRICE purchasing CTEC Pry Led. In essence, the acquisition meant the takeover of two major projects: The Diamantina Power The number of issued shares and the share price are shown Station (DPS) Project in Queensland, Australia, and the in Table 1. West Angelas Power Station (WAPS) Project in the Pilbara Table 1: The Number of Issued Shares and the Share Price region of Western Australia. It was expected that these major 2010 2011 2012 2013 2014 projects would add $7.5 million and $10.8 million to EBITDA No. of Shares 70.649.457 8 81.541.569 86 163.014 85,169014 86.169014 in 2012 and 2013, respectively. The purchase price was $16 Share Price $2.66 54 46 $437 $4.20 million up-front with further payments due on the meeting of specified performance targets (total paid was $32.26 million). This increased FGL's contract book significantly, and its share CTEC PTY LTD PURCHASE price rose in response. In June 2013, FGL acquired Taggart Global for $43 million. This purchase meant that FOL was now In the wash up of the demise of FGL, the attention was paid diversifying into asset management and into other economics. to two main contracts: The Diamantina Power Station (DPS) COMPANY STRUCTURE Project in Queensland, Australia, and the West Angelas Power Station (WAPS) Project in the Pilbara region of Western Australia. Both projects were acquired under the takeover of the company The company's legal structure is shown in Figure 1, but CTEC Pey Led on January 13, 2012. The purchase of CTEC Pry it essentially had four key divisions. They were Power, Led was to change the business model by bringing work in-house Construction, Asset Management, and Minerals and with the intended consequence of taking out the "middle man" Resources. Since listing, the company raised more than $99 million in equity from shareholders and as of June 30, 2013, and thereby increasing earnings (by negating sub-contractor margins). The CTEC purchase payment terms required an had a market capitalization of $356 million with net profit after tax of $63 million on revenue of $1 billion. The order up-front payment of $16 million with subsequent payments Figure 1: Forge Group Led Structure Forge Group Ltd [Aust) Forge Group Forge Group Minerals and Forge Group Asset Forge Alanthus Forge Group Construction Pty Resources Pty Lid Management Ply International Ply Nominees Ply Led Power Ply Led Led (Aust) (Aust) Ltd [Aunt) Lid [Aust) (Aust) Forge Ventures Forge Group Inc Forge Group Asia Energy Inc (Canadal (USA) Pte Lod Maintenance Pty (Singapore) Lid (Aust) Various companies USA, South Africa and China IMA EDUCATIONAL CASE JOURNAL 2 VOL. 8. NO. 1. ART. 3. MARCH 2015conditional on meeting performance criteria (possible further Management Compensation and Ownership of Shares payment of $40 million in tocal). CTEC's prior year (June 30, There was very minor ownership of shares in FGL by 2011) EBIT was $2 million, with expected EBITDA at year-end directors. The ownership of ordinary shares held as of June 2012 and 2013 to be $18.4 million and $24.8 million, respectively. 30, 2013, by the directors were as follows: The DPS and WAPS projects were to increase this expected EBITDA by $7.5 million in 2012 and $10.8 million in 2013. David Simpson, Managing Director Nil - (653 356 performance rights held) Yet the projects' revised 2013 estimates showed a $61 David Craig, Non-executive Chairman 6,000 shares million project margin loss for the DPS project and a $41.7 Marcello Cardaci, Non-executive Director Ni million project margin loss on the WAPS project. The cost John O'Connot, Non-executive Director Nil overmins on these two projects led to the profit downgrade and Gregory Kempton, Non-executive Director 5,000 shares contributed to the resulting showage of cash. Added to that is the discovery that there was an carly The remuneration report shows that payments to the key payment to the vendors of CTEC prior to the performance executives combine both a base salary and performance conditions being met. Further, the previous managing director, incentive bonuses (see Table 2). The performance bonuses Peter Hutchinson, was paid a bonus of $375,000 for a successful were predominately cash and based on earnings per share acquisition and integration. These payments are the subject of (EPS) targets. Performance rights (right to one ordinary share further investigations by the liquidator. in FGL) were also conferred on key executive subject to the The Administrator's report shows that the actual work- achievement of EPS increases over a five-year period. in-progress income for the period was $1 26 million below management's forecast; that labor costs were $70 million over budget, material costs were $55 million over budget; and work- in-progress overheads were $22 million over budget. KEY MANAGEMENT CHANGE There was a major change in management during 2012. Next is a list of holders of substantive management positions in June 2012 and 2013. As of June 20. 2012: Peter Hutchinson Managing Director resigned July 9, 20121 Andrew Ellison Executive Directo resigned July 31, 20121 Gregory Mchostie x Culive Director resigned November 20, 2012] Marcello Candari Non-executive Director David Cella Jan-executive Director Kevin Gallagher Jan-executive Director resigned March 20. 2013 Neil SHfond Jon-executive Director regimed March 28. 2013 As of June 30, 2013: Managing Director and CFO larpointed ,bla, 2ma Marcello Cardio Jon-executive Director David Craig Jan-executive Director .John illConner larpointed Now imher 24 20121 Grag Kempton Non-executive Director appointed November 29. 2012)Tablo 2: Remuneration Information Sign on Performance Cash Salary Retention related Cast Non-monetary Total Short Super Termination Options and Personne % as and Fees Performance Bonus Bonus Benefits term Benefits Annuation Benefits Equity Rights Total Options Related % Executive Director 2013 $950 117 $750 00 $2 577 42 $16.470 $312 107 $2 905,930 Former Executive Directors P. Hutchinson 2013 27 707 27 702 1,368 472 362 2012 955.710 501,540 1.855.710 50. 778 1,906, 438 2014 500 000 587 39 1 2012 754, 12 450 1 249,471 G. Mcfoslie 2013 431 25 500 000 901,25 11,058 1 842,301 757 303 150 000 35, 060 841. 256 Non-Executive Directors IMA EDUCATIONAL CASE JOURNAL 0. Cap 2013 150 601 150.60 13.554 164.155 2017 S 77 40 77 405 6.957 84.376 M. Canlaci 2013 2012 12,50 77 409 77,408 6.957 04,376 J, O'Conner SA STO 4.920 ES G. Kempton 2013 53.956 53.956 6395 Former Non-Executive N Siford 2013 69.375 61 37 71.637 69.375 71 637 71,637
Step by Step Solution
There are 3 Steps involved in it

Get step-by-step solutions from verified subject matter experts