

Question: Please provide an explanation to your answer. Please explain how you determined the answers and how to interpret the graph and #34. Thanks! Figure 12:
Please provide an explanation to your answer. Please explain how you determined the answers and how to interpret the graph and #34. Thanks!
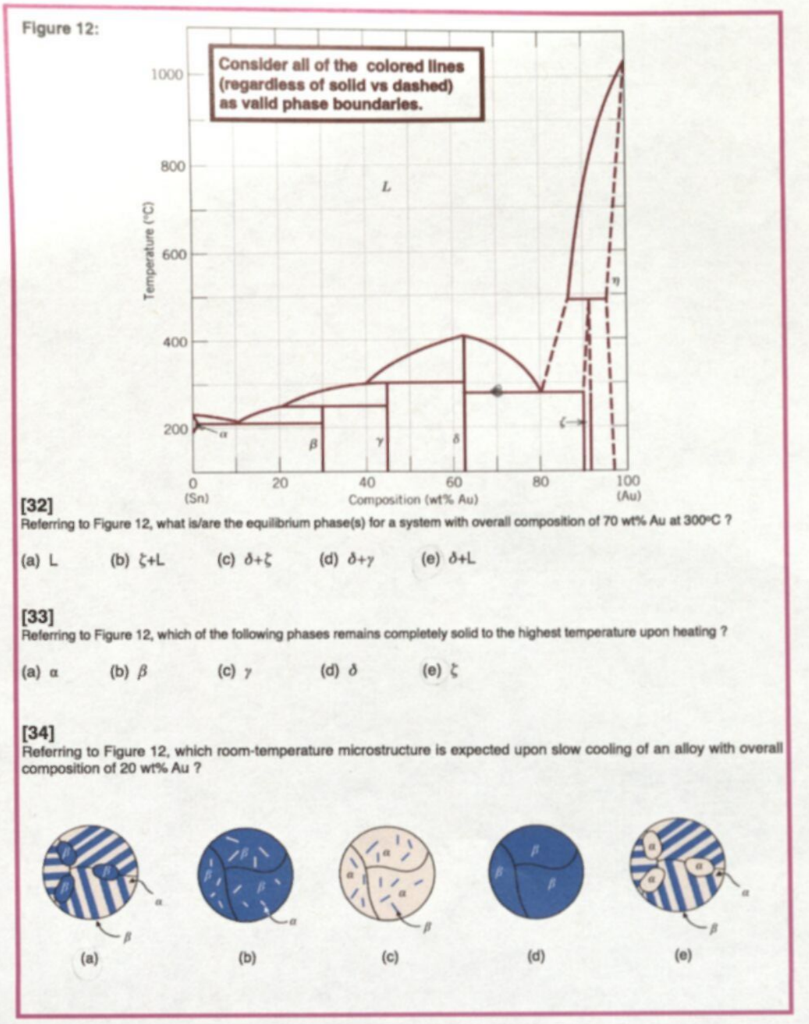
Figure 12: 1000 Consider all of the colored lines (regardless of solld vs dashed) as valid phase boundaries. 800 Temperature (C) 600 400 (4 200 0 20 40 60 80 100 [32] (Sn) Composition (wt% Au) (Au) Referring to Figure 12, what is/are the equilibrium phase(s) for a system with overall composition of 70 wt% Au at 300C ? (a) L (b) 5+L (c) 8+5 (d) Dy (e) 8+L [33] Referring to Figure 12, which of the following phases remains completely sold to the highest temperature upon heating? (a) a (b) B (c) (d) 8 [34] Referring to Figure 12, which room temperature microstructure is expected upon slow cooling of an alloy with overall composition of 20 wt% Au? (a) (b) (c) (d) (e)
Step by Step Solution
There are 3 Steps involved in it

Get step-by-step solutions from verified subject matter experts