

Question: Please provide answer with formulas Input Analysis 100 # of Events Model Inputs Product Type Programs Food Merchandise Cost of Goods Sold (COGS) 40%. 60%
Please provide answer with formulas
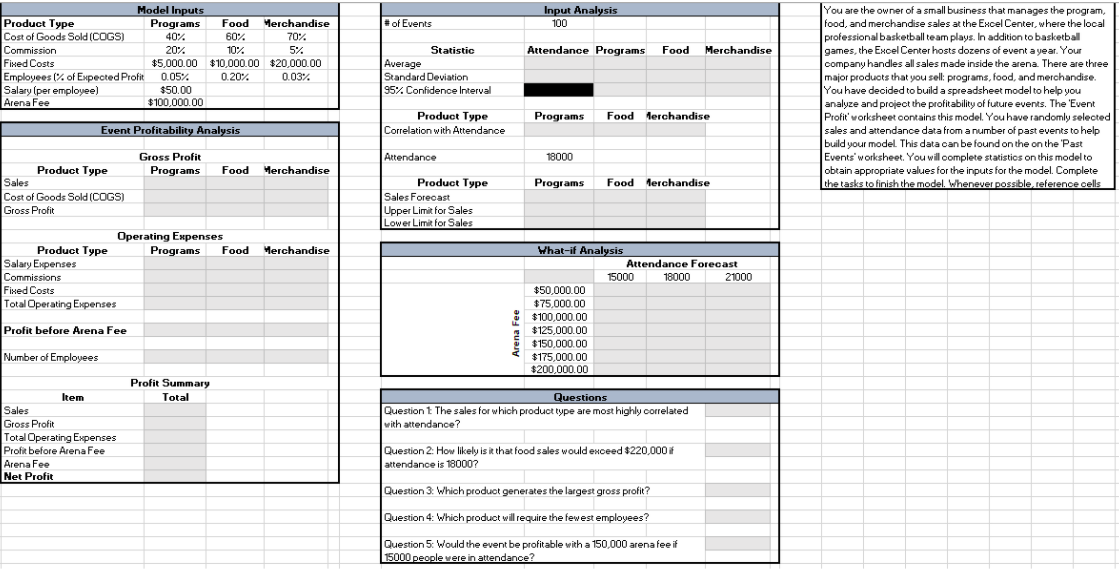
Input Analysis 100 # of Events Model Inputs Product Type Programs Food Merchandise Cost of Goods Sold (COGS) 40%. 60% 70%. Commission 20% 10% 5 5%. Fixed Costs $5,000.00 $10,000.00 $20,000.00 Employees (% of Expected Profit 0.05% 0.20%. % 0.03%. Salary (per employee) $50.00 Arena Fee $100,000.00 Attendance Programs Food Merchandise Statistic Average Standard Deviation 95%. Confidence Interval You are the owner of a small business that manages the program, food, and merchandise sales at the Excel Center, where the local professional basketball team plays. In addition to basketball games, the Excel Center hosts dozens of event a year. Your company handles all sales made inside the arena. There are three major products that you sell programs, food, and merchandise. You have decided to build a spreadsheet model to help you analyze and project the profitability of future events. The 'Event Profit' worksheet contains this model. You have randomly selected sales and attendance data from a number of past events to help build your model. This data can be found on the on the Past Events worksheet. You will complete statistics on this model to obtain appropriate values for the inputs for the model. Complete the tasks to finish the model. Whenever possible, reference cells Programs Food Merchandise Product Type Correlation with Attendance Event Profitability Analysis Attendance 18000 Gross Profit Programs Food Merchandise Product Type Sales Cost of Goods Sold (COGS) Gross Profit Programs Food Merchandise Product Type Sales Forecast Upper Limit for Sales Lower Limit for Sales Merchandise Operating Expenses Product Type Programs Food Salary Expenses Commissions Fixed Costs Total Operating Expenses What-if Analysis Attendance Forecast 15000 18000 21000 $50,000.00 $75,000.00 $100,000.00 $125,000.00 $150,000.00 $175,000.00 $200,000.00 Profit before Arena Fee Arena Fee Number of Employees Profit Summary Total Questions Question t The sales for which product type are most highly correlated with attendance? Item Sales Gross Profit Total Operating Expenses Profit before Arena Fee Arena Fee Net Profit Question 2: How likely is it that food sales would exceed $220,000 if attendance is 18000? Question 3. Which product generates the largest gross profit? Question 4: Which product will require the fewest employees? Question 5: Would the event be profitable with a 150,000 arena fee if 15000 people were in attendance? Input Analysis 100 # of Events Model Inputs Product Type Programs Food Merchandise Cost of Goods Sold (COGS) 40%. 60% 70%. Commission 20% 10% 5 5%. Fixed Costs $5,000.00 $10,000.00 $20,000.00 Employees (% of Expected Profit 0.05% 0.20%. % 0.03%. Salary (per employee) $50.00 Arena Fee $100,000.00 Attendance Programs Food Merchandise Statistic Average Standard Deviation 95%. Confidence Interval You are the owner of a small business that manages the program, food, and merchandise sales at the Excel Center, where the local professional basketball team plays. In addition to basketball games, the Excel Center hosts dozens of event a year. Your company handles all sales made inside the arena. There are three major products that you sell programs, food, and merchandise. You have decided to build a spreadsheet model to help you analyze and project the profitability of future events. The 'Event Profit' worksheet contains this model. You have randomly selected sales and attendance data from a number of past events to help build your model. This data can be found on the on the Past Events worksheet. You will complete statistics on this model to obtain appropriate values for the inputs for the model. Complete the tasks to finish the model. Whenever possible, reference cells Programs Food Merchandise Product Type Correlation with Attendance Event Profitability Analysis Attendance 18000 Gross Profit Programs Food Merchandise Product Type Sales Cost of Goods Sold (COGS) Gross Profit Programs Food Merchandise Product Type Sales Forecast Upper Limit for Sales Lower Limit for Sales Merchandise Operating Expenses Product Type Programs Food Salary Expenses Commissions Fixed Costs Total Operating Expenses What-if Analysis Attendance Forecast 15000 18000 21000 $50,000.00 $75,000.00 $100,000.00 $125,000.00 $150,000.00 $175,000.00 $200,000.00 Profit before Arena Fee Arena Fee Number of Employees Profit Summary Total Questions Question t The sales for which product type are most highly correlated with attendance? Item Sales Gross Profit Total Operating Expenses Profit before Arena Fee Arena Fee Net Profit Question 2: How likely is it that food sales would exceed $220,000 if attendance is 18000? Question 3. Which product generates the largest gross profit? Question 4: Which product will require the fewest employees? Question 5: Would the event be profitable with a 150,000 arena fee if 15000 people were in attendance
Step by Step Solution
There are 3 Steps involved in it

Get step-by-step solutions from verified subject matter experts