

Question: URGENT!!!!!! Excel File Edit View Insert Format Tools Data Window Help a a 20 Wed Apr 6 4:14 PM AutoSave OFF MB2 C... Book3 Home

 URGENT!!!!!!
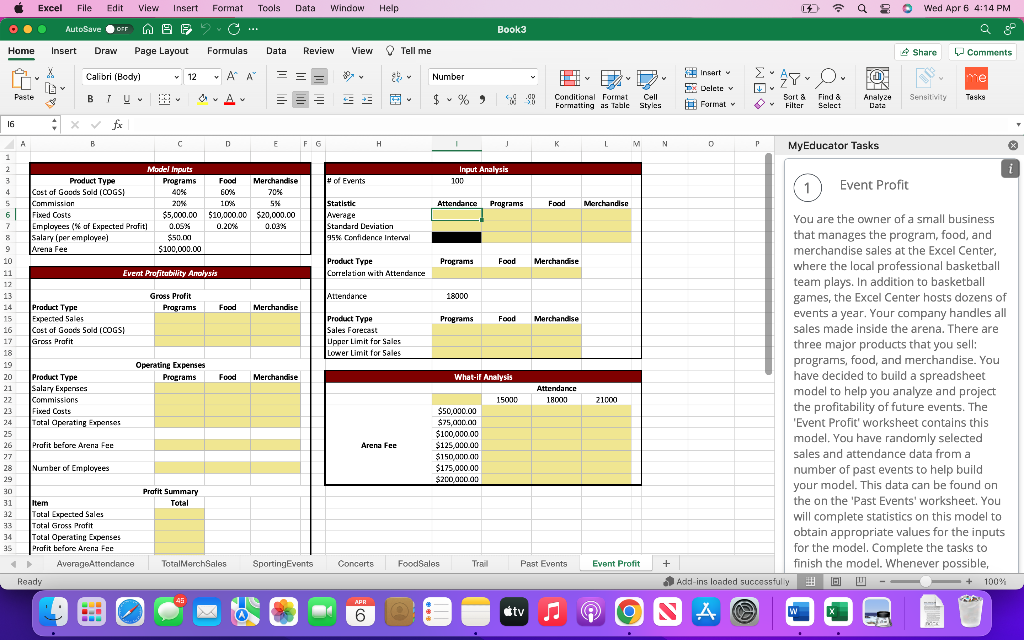
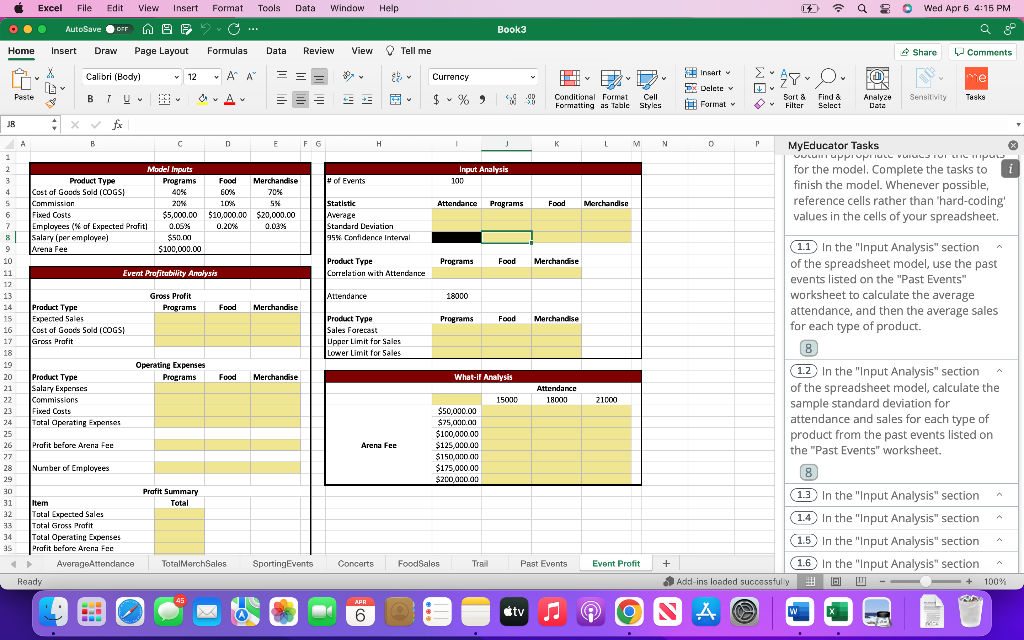
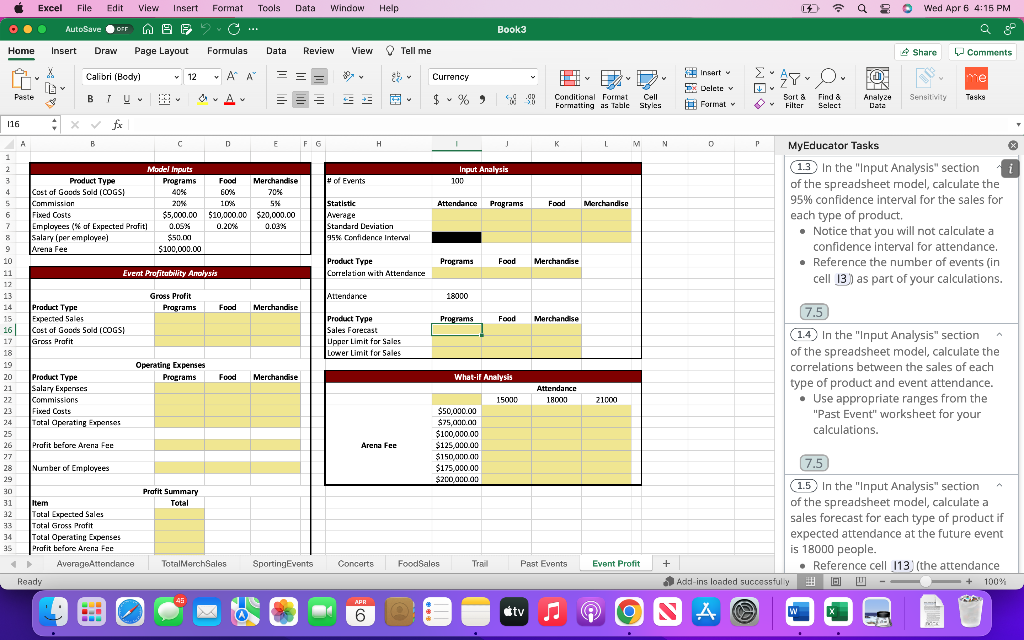
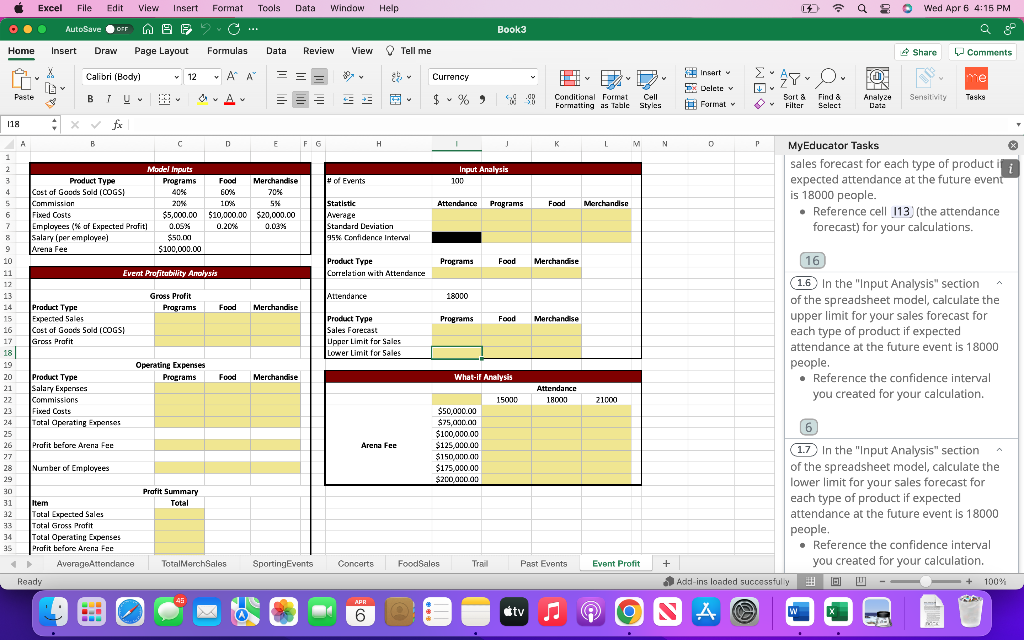
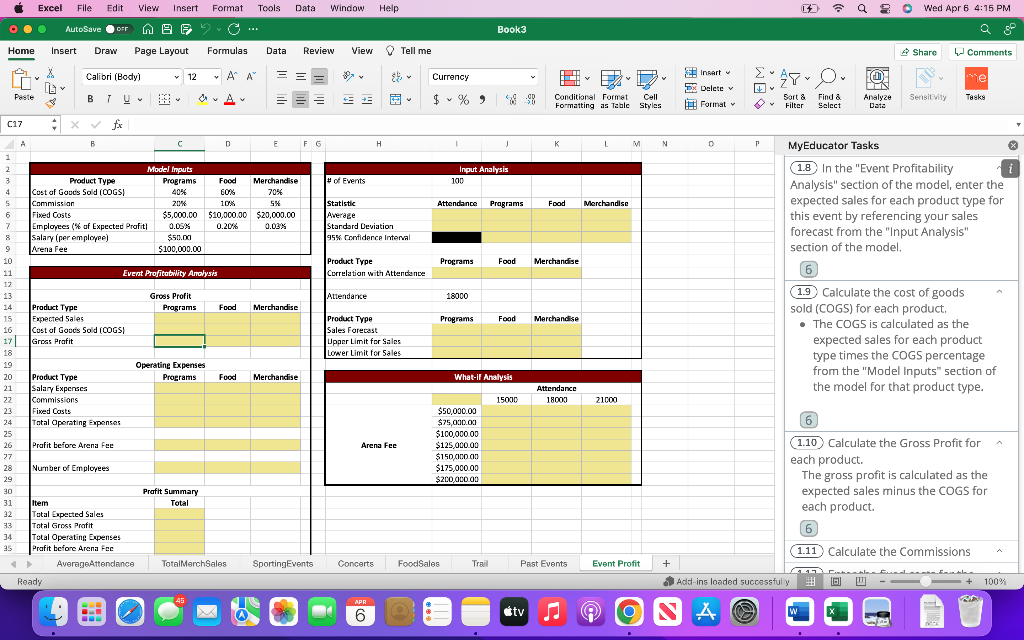
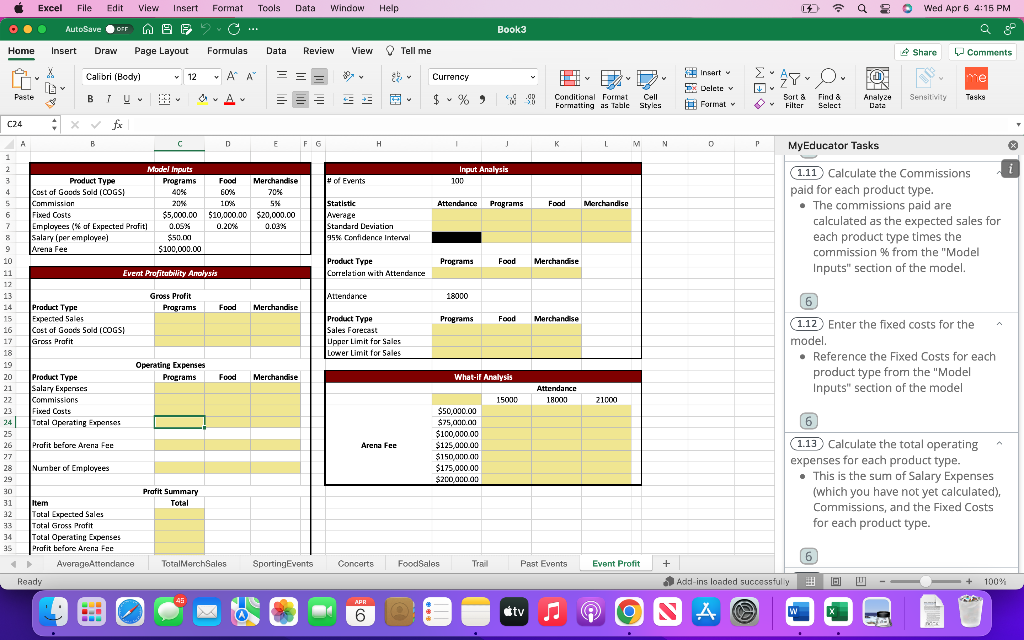
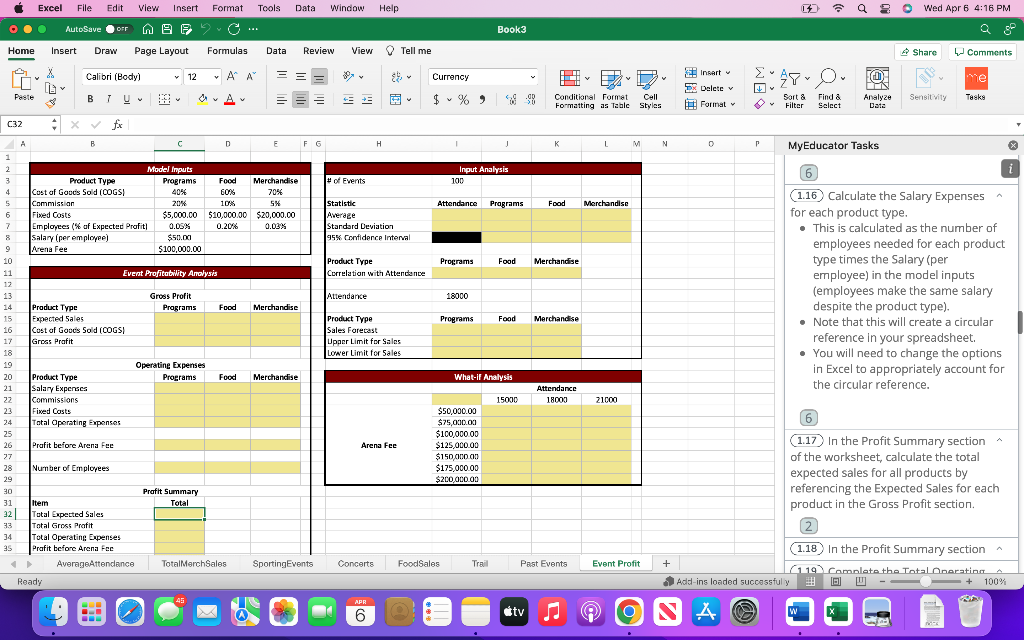
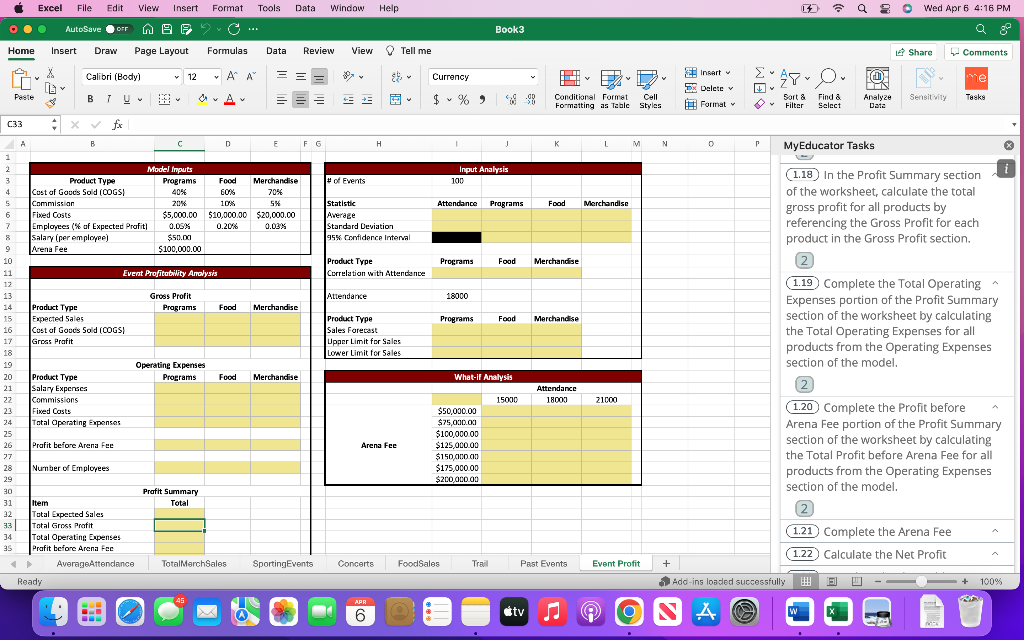
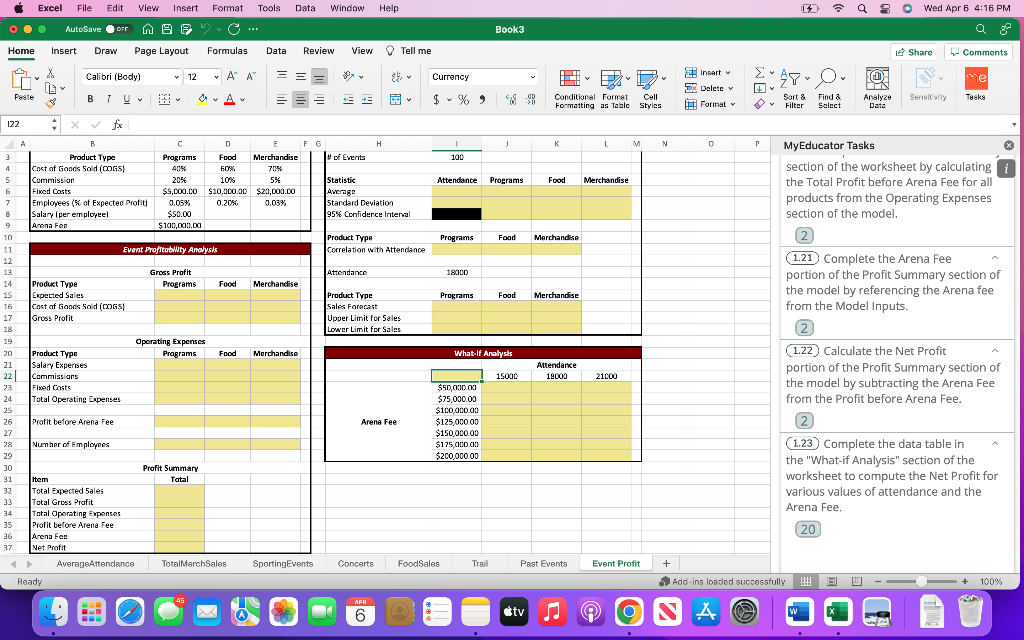
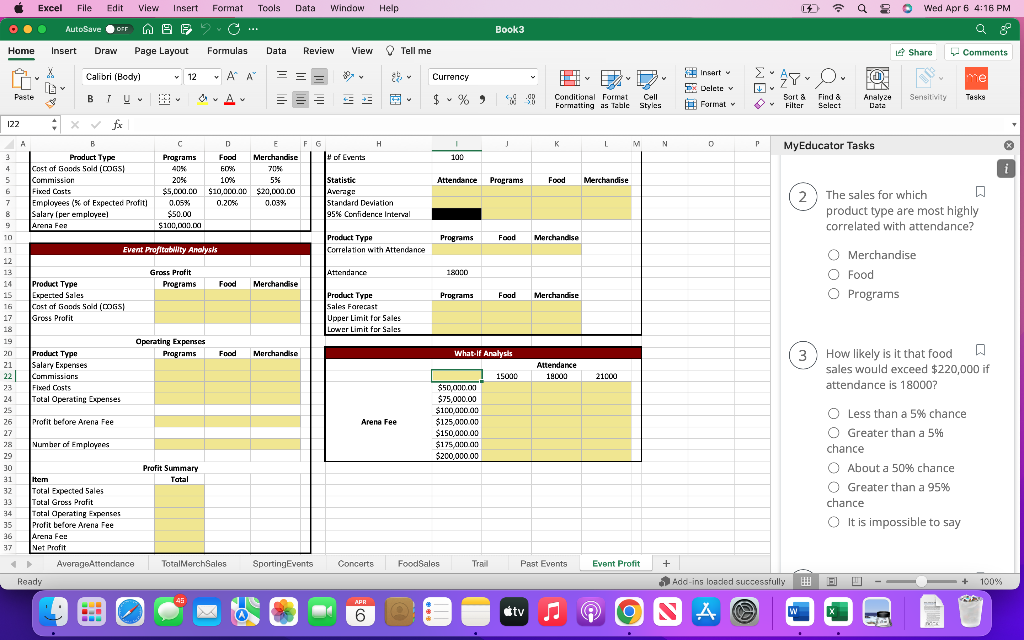
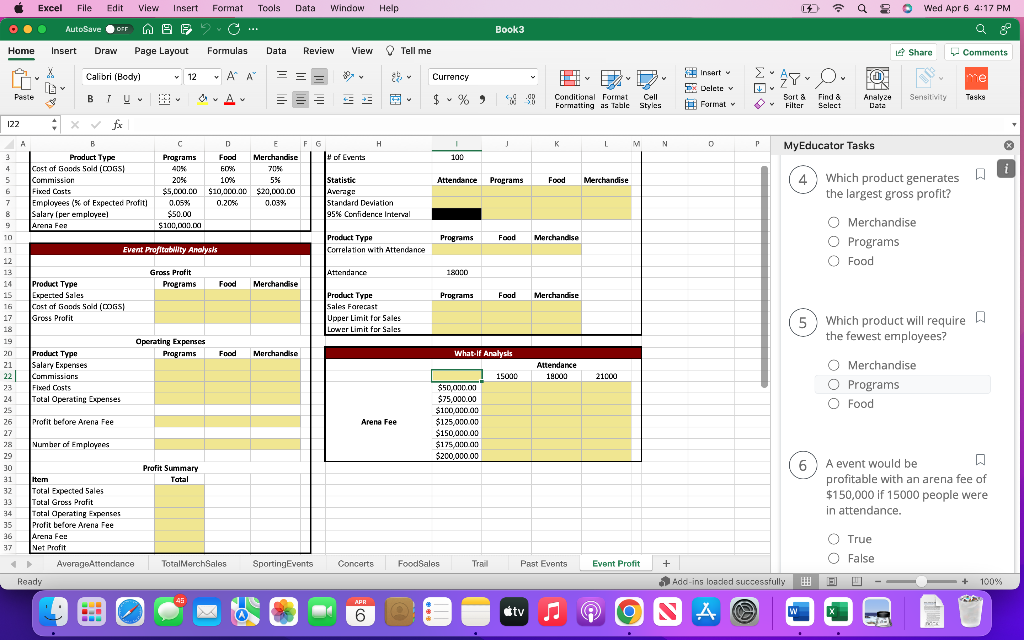
Excel File Edit View Insert Format Tools Data Window Help a a 20 Wed Apr 6 4:14 PM AutoSave OFF MB2 C... Book3 Home Insert Draw Page Layout Formulas Data Review View Tell me Share Comments Calibri (Body) v 12 AA A = V O $ IL Number v Inwart Dk Delete Format ch IN Analyze Data Peste B OA + 3 $ 90 Conditional Format Formatting as Table Cell Styles Tasks Sort & Filter Sensil Vily Find & Select 16 X fc 7 M N 0 P MyEducator Tasks Event Profit Merchandise A B F F G H K K 1 2 Model Inputs Input Analysis 3 Product Type Programs Food Merchandise of Events 100 4 Cost of Goods Sold (COGS 40% 60% 70% 5 Commission 20 10% 5% Statistic Attendance Programs Food 6 Fixed Costs $5,000.co $10,000.00 $20,000.00 Average 7 Employees (% of Expected Profit 0.0SX 0.20% % 0.03% % Stardard Deviation 8 Salary (per employee) $50.00 $ 95% Confidence interval 9 Arena Fee $100,000.00 10 Product Type Programs Food Merchandise 11 Event Profitability Analysis Correlation with Attendance 12 13 Gross Profit Attendance 18000 14 Product Type Programs Food Merchandise 15 Expected Sales Product Type Programs Food Merchandise 16 Cost of Goods Sold (COGS Sales Forecast 17 Gross Profit Upper Limit for Sales 18 Lower Limit for Sales 19 Operating Expenses 20 Product Type Programs Food Merchandise What-il Analysis 21 Salary Expenses Attendance 22 Commissions 15000 18000 23 Fixed Costs $50,000.00 24 Total Operating Expenses $75,000.00 25 $100,000.00 26 Prafit before Arena Fue Arena Fee $125,000.00 27 $150,000.00 28 Nurnber of Employees $175,000.00 29 $200,000.00 30 Pratit Summary 31 Item Total 32 Total Expected Sales 33 Total Gross Profit 34 Total Operating Expenses 35 Profit before Arena Fcc AverageAttendance Total MerchSales Sporting Events Concerts FoodSales Trail Past Events Ready 21000 You are the owner of a small business that manages the program, food, and merchandise sales at the Excel Center, where the local professional basketball team plays. In addition to basketball games, the Excel Center hosts dozens of events a year. Your company handles all sales made inside the arena. There are three major products that you sell: programs, food, and merchandise. You have decided to build a spreadsheet model to help you analyze and project the profitability of future events. The 'Event Profit' worksheet contains this ma model. You have randomly selected sales and attendance data from a number of past events to help build your model. This data can be found on the on the 'Past Events' worksheet. You will complete statistics on this model to obtain appropriate values for the inputs for the model. Complete the tasks to finish the model. Whenever possible, Add-ins loaded successfully W - NA Event Profit + + 100% 45 APR 6 3 tv w Excel File Edit View Insert Format Tools Data Window Help a 80 a Wed Apr 6 4:15 PM AutoSave OFF MB2 C... Book3 Home Insert Draw Page Layout Formulas Data Review View Tell me Share W Comments Calibri (Body) v 12 AA A = V O sy Currency IL v Inwart Dk Delete Format Peste B OA + $ 3 % ) Conditional Format Formatting an Table Cell Styles Sort & Filter IN Analyze Data Tasks Find & Select Sensil Vily JB X fc 7 M N P MyEducator Tasks . for the model. Complete the tasks to finish the model. Whenever possible, reference cells rather than 'hard-coding values in the cells of your spreadsheet. Merchandise A B D F F G H K 1 2 Model Inputs Input Analysis 3 Product Type Programs Food Merchandise of Events 100 4 Cost of Goods Sold (COGS 40% 60% 70% 5 Commission 20 10% 5% Statistic Attendance Programs Food 6 Fixed Costs $5,000.co $10,000.00 $20,000.00 Average 7 7 Employees (% of Expected Profit 0.0SX 0.20% % 0.03% % Stardard Deviation Salary (per employee) $50.00 $ 95% Contidence interval 9 9 Arena Fee $100,000.00 10 Product Type Programs Food Merchandise 11 Event Profitability Analysis Correlation with Attendance 12 13 Gross Profit Attendance 18000 14 Product Type Programs Food Merchandise 15 Expected Sales Product Type Programs Food Merchandise 16 Cost of Goods Sold (COGS Sales Forecast 17 Gross Profit Upper Limit for Sales 18 Lower Limit for Sales 19 Operating Expenses 20 Product Type Programs Food Merchandise What-il Analysis 21 Salary Expenses Attendance 22 Commissions 15000 18000 23 Fixed Costs $50,000.00 24 Total Operating Expenses $75,000.00 25 $100,000.00 26 Prafit before Arena Fue Arena Fee $125,000.00 27 $150,000.00 28 Nurnber of Employees $175,000.00 29 $200,000.00 30 Pratit Summary 31 Item Total 32 Total Expected Sales 33 Total Gross Profit 34 Total Operating Expenses 35 Profit before Arena Fcc AverageAttendance Total MerchSales Sporting Events Concerts FoodSales Trail Past Events Ready 1.1 In the "Input Analysis" section of the spreadsheet model, use the past events listed on the "Past Events" worksheet to calculate the average attendance, and then the average sales for each type of product. 8 1.2 In the "Input Analysis" section of the spreadsheet model, calculate the sample standard deviation for attendance and sales for each type of product from the past events listed on the "Past Events" worksheet. 21000 8 (1.3) In the "Input Analysis" section 1.4 In the "Input Analysis" section (1.5 In the "Input Analysis" section 1.6 In the "Input Analysis" section Add-ins loaded successfully ) 0 - + 100% Event Profit + 45 APR 6 3 tv NA w Excel File Edit View Insert Format Tools Data Window Help a 80 Q8 Wed Apr 6 4:15 PM AutoSave OFF MB2 C... Book3 Home Insert Draw Page Layout Formulas Data Review View Tell me Share W Comments V v Peste Y Calibri (Body) v 12 AA A = O sy Inwart Currency IL Fan Dk Delete IN B OA + $ %) Conditional Format 90 3 Cell Sort & Find & Analyze Sensit Vily Tasks Formatting as Table Styles Format Filter Select Data 116 . X fc B F F G H K K M N 0 P MyEducator Tasks 1 1 2 Model Inputs Input Analysis 13 In the "Input Analysis" section 3 Product Type Programs Food Merchandise of Events 100 of the spreadsheet model, calculate the 4 Cost of Goods Sold (COGS 40% 60% 70% 5 Commission 20 10% 5% Statistic Attendance Programs Food Merchandise 95% confidence interval for the sales for 6 Fixed Costs $5,000.co $10,000.00 $20,000.00 Average each type of product. 7. Employees (% of Expected Profit 0.0SX 0.20% % 0.03% Stardard Deviation Salary (per employee) $50.00 $ 95% Contidence interval Notice that you will not calculate a 9 Arena Fee $100,000.00 confidence interval for attendance, 10 Product Type Programs Food Merchandise Reference the number of events in 11 Event Profitability Analysis Correlation with Attendance 12 cell 13) as part of your calculations. 13 Gross Profit Attendance 18000 14 Product Type Programs Food Merchandise (7.5 15 Expected Sales Product Type Programs Food Merchandise 16 Cost of Goods Sold (COGS Sales Forecast 17 1.4 In the "Input Analysis" section Gross Profit Upper Limit for Sales 18 Lower Limit for Sales of the spreadsheet model, calculate the 19 Operating Expenses correlations between the sales of each 20 Product Type Programs Food Merchandise What-il Analysis 21 Salary Expenses Attendance type of product and event attendance. 22 Commissions 15000 18000 21000 Use appropriate ranges from the 23 Fixed Costs $50,000.00 "Past Event" worksheet for your 24 Total Operating Expenses $75,000.00 25 $100,000.00 calculations. 26 Prafit before Arena Fue Arena Fee $125,000.00 27 $150,000.00 28 Nurnber of Employees $175,000.00 7.5 29 $200,000.00 Pratit Summary 1.5 In the "Input Analysis" section 30 31 Item Total of the spreadsheet model, calculate a 32 Total Expected Sales sales forecast for each type of product if 33 Total Gross Profit 34 Total Operating Expenses expected attendance at the future event 35 Profit before Arena Fcc is 18000 people. AverageAttendance Total MerchSales Sporting Events Concerts FoodSales Trail Past Events Event Profit + Reference cell 113) (the attendance Ready Add-ins loaded successfully U 0 + 100% 45 APR 6 tv NA w 3 Excel File Edit View Insert Format Tools Data Window Help a 80 Q8 Wed Apr 6 4:15 PM AutoSave OFF MB2 C... Book3 Home Insert Draw Page Layout Formulas Data Review View Tell me Share W Comments V Inwart Dk Delete Format ch IN Analyze Data Peste Sort & & Filter Find & Select Sensil Vily Tasks 0 P MyEducator Tasks 23 sales forecast for each type of product expected attendance at the future event is 18000 people. Reference cell 113, (the attendance forecast) for your calculations. Attendance Calibri (Body) v 12 AA A = O sy Currency IL v B OA + 3 $ %) Conditional Format 90 Cell Formatting as Table Styles 118 X fc A B F F G H K M N 1 2 Model Inputs Input Analysis 3 Product Type Programs Food Merchandise of Events 100 4 Cost of Goods Sold (COGS 40% 60% 70% 5 Commission 20 10% 5% Statistic Programs Food Merchandise 6 Fixed Costs $5,000.co $10,000.00 $20,000.00 Average 7. Employees (% of Expected Profit 0.0SX 0.20% % 0.03% % Stardard Deviation Salary (per employee) $50.00 $ 95% Contidence interval 9 Arena Fee $100,000.00 10 Product Type Programs Food Merchandise 11 Event Profitability Analysis Correlation with Attendance 12 13 Gross Profit Attendance 18000 14 Product Type Programs Food Merchandise 15 Expected Sales Product Type Programs Food Merchandise 16 Cost of Goods Sold (COGS Sales Forecast 17 Gross Profit Upper Limit for Sales 18| LON'er Limit for Sales 19 Operating Expenses 20 Product Type Programs Food Merchandise What-il Analysis 21 Salary Expenses Attendance 22 Commissions 15000 18000 21000 23 Fixed Costs $50,000.00 24 Total Operating Expenses $75,000.00 25 $100,000.00 26 Prafit before Arena Fue Arena Fee $125,000.00 27 $150,000.00 28 Nurnber of Employees $175,000.00 29 $200,000.00 30 Pratit Summary 31 Item Total 32 Total Expected Sales 33 Total Gross Profit 34 Total Operating Expenses 35 Profit before Arena Fcc AverageAttendance Total MerchSales Sporting Events Concerts FoodSales Trail Past Events Event Profit + Ready 16 1.6 In the "Input Analysis" section of the spreadsheet model, calculate the upper limit for your sales forecast for each type of product if expected attendance at the future event is 18000 people. Reference the confidence interval you created for your calculation. 6 1.7 In the "Input Analysis" section of the spreadsheet model, calculate the lower limit for your sales forecast for each type of product if expected attendance at the future event is 18000 people, Reference the confidence interval you created for your calculation. Add-ins loaded successfully 3 0 - - 100% 45 APR 6 3 tv NA w SA Excel File Edit View Insert Format Tools Data Window Help a 80 a Wed Apr 6 4:15 PM AutoSave OFF MB2 C... Book3 Home Insert Draw Page Layout Formulas Data Review View Tell me Share W Comments Calibri (Body) v 12 AA A = V O $ Currency IL v Inwart Dk Delete Format ch IN Analyze Data Paste B TU OA 3 + $ %) Conditional Format Formatting an Table Cell Styles Sort & Filter Tasks Sensit Vily Find & Select C17 . X fc M N 0 P X MyEducator Tasks 1.8 In the "Event Profitability Analysis" section of the model, enter the expected sales for each product type for this event by referencing your sales forecast from the "Input Analysis" section of the model. Merchandise 6 B c n F F G H K K 1 2 Model imputs Input Analysis 3 Product Type Programs Food Merchandise of Events 100 4 Cost of Goods Sold (COGS 40% 60% 70% 5 Commission 20 10% 5% Statistic Attendance Program: Food 6 Fixed Costs $5,000.co $10,000.00 $20,000.00 Average 7. Employees (% of Expected Profit 0.0SX 0.20% % 0.03% % Stardard Deviation Salary (per employee) $50.00 $ 95% Contidence interval 9 Arena Fee $100,000.00 10 Product Type Programs Food Merchandise 11 Event Profitability Analysis Correlation with Attendance 12 13 Gross Profit Attendance 18000 14 Product Type Programs Food Merchandise 15 Expected Sales Product Type Programs Food Merchandise 16 Cost of Goods Sold (COGS) Sales Forecast 17. Gross Profit Upper Limit for Sales 18 Lower Limit for Sales 19 Operating Expenses 20 Product Type Programs Food Merchandise What-il Analysis 21 Salary Expenses Attendance 22 Commissions 15000 18000 23 Fixed Costs $50,000.00 24 Total Operating Expenses $75,000.00 25 $100,000.00 26 Prafit before Arena Fue Arena Fee $125,000.00 27 $150,000.00 28 Nurnber of Employees $175,000.00 29 $200,000.00 30 Pratit Summary 31 Item Total 32 Total Expected Sales 33 Total Gross Profit 34 Total Operating Expenses 35 Profit before Arena Fcc AverageAttendance Total MerchSales Sporting Events Concerts FoodSales Trail Past Events Ready 1.9 Calculate the cost of goods sold (COGS) for each product. The COGS is calculated as the expected sales for each product type times the COGS percentage from the "Model Inputs" section of the model for that product type. 21000 6 1.10 Calculate the Gross Profit for each product. The gross profit is calculated as the expected sales minus the COGS for each product. 6 1.11 Calculate the Commissions Event Profit + Add-ins loaded successfully 11 ! 0 + 100% 45 APR 6 3 tv NA w Excel File Edit View Insert Format Tools Data Window Help a 80 O Wed Apr 6 4:15 PM AutoSave OFF MB2 C... Book3 Home Insert Draw Page Layout Formulas Data Review View Tell me Share W Comments Calibri (Body) v 12 AA A = V O $ Currency IL v Inwart Dk Delete Format ch IN Analyze Data Paste B TU 3 OA + $ %) Conditional Format Formatting an Table Cell Styles Sort & Filter Sensil vity Find & Select C24 X fc M N P MyEducator Tasks Merchandise 1.11 Calculate the Commissions paid for each product type. The commissions paid are calculated as the expected sales for each product type times the commission % from the "Model Inputs" section of the model. 6 A B c n F F G H K K 1 2 Model imputs Input Analysis 3 Product Type Programs Food Merchandise of Events 100 4 Cost of Goods Sold (COGS 40% 60% 70% 5 Commission 20 10% 5% Statistic Attendance Program: Food 6 Fixed Costs $5,000.co $10,000.00 $20,000.00 Average 7. Employees (% of Expected Profit 0.0SX 0.20% % 0.03% Stardard Deviation Salary (per employee) $50.00 $ 95% Contidence interval 9 Arena Fee $100,000.00 10 Product Type Programs Food Merchandise 11 Event Profitability Analysis Correlation with Attendance 12 13 Gross Profit Attendance 18000 14 Product Type Programs Food Merchandise 15 Expected Sales Product Type Programs Food Merchandise 16 Cost of Goods Sold (COGS Sales Forecast 17 Gross Profit Upper Limit for Sales 18 Lower Limit for Sales 19 Operating Expenses 20 Product Type Programs Food Merchandise What-il Analysis 21 Salary Expenses Attendance 22 Commissions 15000 18000 23 Fixed Costs $50,000.00 24 Total Operating Expenses $75,000.00 25 $100,000.00 26 Prafit before Arena Fue Arena Fee $125,000.00 27 $150,000.00 28 Nurnber of Employees $175,000.00 29 $200,000.00 30 Pratit Summary 31 Item Total 32 Total Expected Sales 33 Total Gross Profit 34 Total Operating Expenses 35 Profit before Arena Fcc AverageAttendance Total MerchSales Sporting Events Concerts FoodSales Trail Past Events Ready 1.12 Enter the fixed costs for the model Reference the Fixed Costs for each product type from the "Model Inputs" section of the model 21000 6 1.13 Calculate the total operating expenses for each product type. . This is the sum of Salary Expenses (which you have not yet calculated), Commissions, and the Fixed Costs for each product type. 6 Event Profit + Add-ins loaded successfully !!! 10 - O + 100% 45 APR 6 3 tv NA w Excel File Edit View Insert Format Tools Data Window Help a 80 a Wed Apr 6 4:16 PM AutoSave OFF MB C... Book3 Home Insert Draw Page Layout Formulas Data Review View Tell me Share Comments Calibri (Body) v 12 AA A = V O $ Number IL ch v Inwart Dk Delete Format Peste B TU OA 3 + $ 90 Cell Styles Conditional Format Formatting an Table Sort & & Filter Sensil vity Find & Select Tasks Analyze Data C28 X fc B c n F F G H K M N P MyEducator Tasks X 6 Input Analysis 100 of Events 1 2 3 4 5 6 7. Attendance Programs Food Merchandise Model imputs Product Type Programs Food Merchandise Cost of Goods Sold (COGS 40% 60% 70% Commission 20 10% 5% Fixed Costs $5,000.co $10,000.00 $20,000.00 Employees (% of Expected Profit 0.0SX 0.20% % 0.03% Salary (per employee) $50.00 $ Arena Fee $100,000.00 Statistic Average Stardard Deviation 95% Contidence interval 1.14 Calculate the Profit before Arena Fee for each product type. This is the Gross Profit minus the Total Operating Expenses (including Salary Expenses - which you have not yet calculated) for each type of product. Programs Food Merchandise Product Type Correlation with Attendance Event Profitability Analysis Attendance 18000 Gross Profit Programs Food Merchandise Programs Food Merchandise Product Type Expected Sales Cost of Goods Sold (COGS Gross Profit Product Type Sales Forecast Upper Limit for Sales Lower Limit for Sales Operating Expenses Programs Food Merchandise What-il Analysis 9 10 11 12 13 14 15 16 17 18 19 20 21 22 23 24 25 26 27 28 29 30 31 32 33 34 35 Product Type Salary Expenses Commissions Fixed Costs Total Operating Expenses Attendance 18000 15000 21000 6 1.15 Calculate the number of employees needed to work the event for each type of product This is calculated as the Profit carca.com Before Arena Fee for each type of . product times the Employees (% of Expected Profit) for each product type from the model inputs. Since you can't hire a fraction of an employee, be sure to round your calculations up to the next whole employee. Prafit before Arena Fue $50,000.00 $75,000.00 $100,000.00 $125,000.00 $150,000.00 $175,000.00 $200,000.00 Arena Fee Number of Employees Profit Summary Total Item Total Expected Sales Total Gross Profit Total Operating Expenses Prafit before Arena Fee 6 AverageAttendance Total MerchSales Sporting Events Concerts FoodSales Trail Past Events Event Profit + (116 calculate the Salan, Evnanses Add-ins loaded successfully ! 0 U -- + 100% Ready 45 APR 6 3 tv NA w Excel File Edit View Insert Format Tools Data Window Help a 80 O Wed Apr 6 4:16 PM AutoSave or OFF MB2 C... Book3 Home Insert Draw Page Layout Formulas Data Review View Tell me Share W Comments Calibri (Body) v 12 AA A = V O . $ Currency IL v Inwart Dk Delete Format ch IN Analyze Data B TU 3 OA + $ %) Conditional Format Formatting an Table Cell Styles Sort & Filter Find & Select Sensitvity C32 . X fc M N 0 P MyEducator Tasks 6 Merchandise B c n F F G H K K 1 2 Model imputs Input Analysis 3 Product Type Programs Food Merchandise of Events 100 4 Cost of Goods Sold (COGS 40% 60% 70% 5 Commission 20 10% 5% Statistic Attendance Program: Food 6 Fixed Costs $5,000.co $10,000.00 $20,000.00 Average 7. Employees (% of Expected Profit 0.0SX 0.20% % 0.03% Stardard Deviation Salary (per employee) $50.00 $ 95% Contidence interval 9 Arena Fee $100,000.00 10 Product Type Programs Food Merchandise 11 Event Profitability Analysis Correlation with Attendance 12 13 Gross Profit Attendance 18000 14 Product Type Programs Food Merchandise 15 Expected Sales Product Type Programs Food Merchandise 16 Cost of Goods Sold (COGS Sales Forecast 17 Gross Profit Upper Limit for Sales 18 Lower Limit for Sales 19 Operating Expenses 20 Product Type Programs Food Merchandise What-il Analysis 21 Salary Expenses Attendance 22 Commissions 15000 18000 23 Fixed Costs $50,000.00 24 Total Operating Expenses $75,000.00 25 $100,000.00 26 Prafit before Arena Fue Arena Fee $125,000.00 27 $150,000.00 28 Nurnber of Employees $175,000.00 29 $200,000.00 30 31 Item Total 32 | Total Expected Sales 33 Total Gross Profit 34 Total Operating Expenses 35 Profit before Arena Fcc AverageAttendance Total MerchSales Sporting Events Concerts FoodSales Trail Past Events Ready 1.16 Calculate the Salary Expenses A for each product type. This is calculated as the number of employees needed for each product type times the Salary(per employee) in the model inputs (employees make the same salary despite the product type). . Note that this will create a circular reference in your spreadsheet. You will need to change the options in Excel to appropriately account for the circular reference. 21000 Profit Summary 6 1.17 In the Profit Summary section of the worksheet, calculate the total expected sales for all products by referencing the Expected Sales for each product in the Gross Profit section. 2 (1.18 In the Profit Summary section - ( (119) Complete the total narating A Add-ins loaded successfully? - 0 100% Event Profit + + 45 APR 6 3 tv NA w Excel File Edit View Insert Format Tools Data Window Help O Wed Apr 6 4:16 PM AutoSave OFF MB C... Book3 Home Insert Draw Page Layout Formulas Data Review View Tell me Share Comments Calibri (Body) v 12 AA A = V O Currency IL (ch) v Inwart Dk Delete Format Peste B TU OA 3 + $ % ) Conditional Format Formatting an Table Cell Styles Taska Sort & Filter Find & Select Sensit Vily Analyze Data C33 . X fc M N 0 P MyEducator Tasks Merchandise A B c n F F G H K K 1 2 Model imputs Input Analysis 3 Product Type Programs Food Merchandise of Events 100 4 Cost of Goods Sold (COGS 40% 60% 70% 5 Commission 20 10% 5% Statistic Attendance Program: Food 6 Fixed Costs $5,000.co $10,000.00 $20,000.00 Average 7. Employees (% of Expected Profit 0.05% 0.20% % 0.03% Stardard Deviation Salary (per employee) $50.00 $ 95% Contidence interval 9 Arena Fee $100,000.00 10 Product Type Programs Food Merchandise 11 Event Profitability Analysis Correlation with Attendance 12 13 Gross Profit Attendance 18000 14 Product Type Programs Food Merchandise 15 Expected Sales Product Type Programs Food Merchandise 16 Cost of Goods Sold (COGS Sales Forecast 17 Gross Profit Upper Limit for Sales 18 Lower Limit for Sales 19 Operating Expenses 20 Product Type Programs Food Merchandise What-il Analysis 21 Salary Expenses Attendance 22 Commissions 15000 18000 23 Fixed Costs $50,000.00 24 Total Operating Expenses $75,000.00 25 $100,000.00 26 Prafit before Arena Fue Arena Fee $125,000.00 27 $150,000.00 28 Nurnber of Employees $175,000.00 29 $200,000.00 30 Profit Summary 31 Item Total 32 Total Expected Sales 33 Total Gross Profit 34 Total Operating Expenses 35 Prafit before Arena Fee AverageAttendance Total MerchSales Sporting Events Concerts FoodSales Trail Past Events Ready 1.18 In the Profit Summary section of the worksheet, calculate the total gross profit for all products by referencing the Gross Profit for each product in the Gross Profit section. 2 1.19 Complete the Total Operating Expenses portion of the Profit Summary section of the worksheet by calculating the Total Operating Expenses for all products from the Operating Expenses section of the model. 2 1.20 Complete the Profit before Arena Fee portion of the Profit Summary section of the worksheet by calculating the Total Profit before Arena Fee for all products from the Operating Expenses section of the model. 2 1.21 Complete the Arena Fee 1.22 Calculate the Net Profit 21000 Event Profit + Add-ins loaded successfully 5 - + 100% 45 APR 6 3 tv NA w Excel File Edit View Insert Format Tools Data Window Help O Wed Apr 6 4:16 PM AutoSave or OFF MB2 C... Book3 Home Insert Draw Page Layout Formulas Data Review View Tell me Share - Comments Calibri (Body) v 12 AA A = Oy $9 Currency IL (ch) v Inwart DX Delete Format Peste B TU 11 3 OA + $ % ) Conditional Format Formatting as Table Cell Styles Sort & & Filter Find & Select Tasks Sensit Vily Analyze Data 122 X fc F G H j K L M N 0 P of Events 100 10% Attendance Programs A B Product Type Cost of Goods Sold (C065 Commission Fixed Costs Employees of Expected Profit Salary (per employee Arena Fon 4 5 6 7. Merchandise C E Programs Food Merchandise 40% 60% 70% 20% 5% $5,000.CO $10,000.00 $20,000.00 $ 0.05% 0.20% 0.03% $50.00 $100,000.00 Food Statistic Average Standard Deviation 95% Confidence interval Programs Food Merchandise Product Type Correlation with Attendance Event ProfitabWty Analysis Attendance 18000 Gross Profit Programs Food Merchandise Product Type Programs Food Product Type Expected Sales Cost of Gands Sold (COGS Gross Profit Merchandise Sales Farerast Upper Limit for Sales Lower Limit for Sales MyEducator Tasks section of the worksheet by calculating the Total Profit before Arena Fee for all products from the Operating Expenses section of the model. 2 1.21 Complete the Arena Fee portion of the Profit Summary section of the model by referencing the Arena fee from the Model Inputs. 2 1.22 Calculate the Net Profit portion of the Profit Summary section of the model by subtracting the Arena Fee from the Profit before Arena Fee. 2 (1.23) Complete the data table in the "What-if Analysis" section of the worksheet to compute the Net Profit for various values of attendance and the Arena Fee. 20 Operating Expenses Programs Food Merchandise What If Analysis Product Type Salary Expenses Commissions Fixed Costs Total Operating Expenses Attendance 19000 9 10 11 12 13 14 15 16 17 18 19 20 21 22 23 24 25 26 27 28 29 30 31 32 33 34 35 36 37 15000 21000 Profit before Arena Fee Arena Fee $50,000.00 $75,000.00 $100,000.00 $125,000.00 $150,000.00 $175,000.00 $200,000.00 Number of Employees Profit Summary Tatal Item Total Expected Sales Total Gross Profit Total Operating Expenses Profit before Arena Fee Arena Fee Net Profit AverageAttendance Total MerchSales Sporting Events Concerts FoodSales Trail Past Events Event Profit + Ready Add-ins loaded successfully !! - - 5 + 100% 45 APR 6 3 tv s 4 w Excel File Edit View Insert Format Tools Data Window Help a O Wed Apr 6 4:16 PM AutoSave or OFF MB2 C... Book3 Home Insert Draw Page Layout Formulas Data Review View Tell me A Share Comments Calibri (Body) v 12 AA A = Oy $9 Currency IL (ch) v Inwart DX Delete Format Peste B TU 11 3 OA + $ % ) Taska Conditional Format Formatting as Table Cell Styles Sort & Filter Find & Select Sensitivity Analyze Data 122 X fc F G H j K L M N 0 P MyEducator Tasks of Events 100 10% Attendance Programs A B Product Type Cost of Goods Sold (C065 Commission Fixed Costs Employees of Expected Profit Salary (per employee Arena Fon 4 5 6 7. Merchandise C E Programs Food Merchandise 40% 60% 70% 20% 5% $5,000.CO $10,000.00 $20,000.00 $ 0.05% 0.20% 0.03% $50.00 $100,000.00 Food Statistic Average Standard Deviation 95% Confidence interval 2) The sales for which product type are most highly correlated with attendance? Programs Food Merchandise Product Type Correlation with Attendance Event ProfitabWty Analysis Attendance 18000 Gross Profit Programs O Merchandise O Food O Programs Food Merchandise Product Type Programs Food Product Type Expected Sales Cost of Gands Sold (COGS Gross Profit Merchandise Sales Farerast Upper Limit for Sales Lower Limit for Sales Operating Expenses Programs Food Merchandise What If Analysis 3 Product Type Salary Expenses Commissions Fixed Costs Total Operating Expenses Attendance 19000 9 10 11 12 13 14 15 16 17 18 19 20 21 22 23 24 25 26 27 28 29 30 31 32 33 34 35 36 37 How likely is it that food sales would exceed $220,000 if attendance is 18000? 15000 21000 Profit before Arena Fee Arena Fee $50,000.00 $75,000.00 $100,000.00 $125,000.00 $150,000.00 $175,000.00 $200,000.00 Number of Employees Profit Summary Tatal O Less than a 5% chance a 5 O Greater than a 5% chance About a 50% chance O Greater than a 95% chance O It is impossible to say Item Total Expected Sales Total Gross Profit Total Operating Expenses Profit before Arena Fee Arena Fee Net Profit AverageAttendance Total MerchSales Sporting Events Concerts FoodSales Trail Past Events Event Profit + Ready Add-ins loaded successfully 1 - - 100% 45 APR 6 3 tv NA w Excel File Edit View Insert Format Tools Data Window Help O Wed Apr 6 4:17 PM AutoSave or OFF MB2 C... Book3 Home Insert Draw Page Layout Formulas Data Review View Tell me Share - Comments Calibri (Body) v 12 AA A = Oy $9 Currency IL (ch) v Inwart Dk Delete Format Peste B TU 11 3 OA + $ % ) Conditional Format Formatting as Table Cell Styles Sort & Filter Find & Select Sensitivity Analyze Data Tasks 122 X fc F G H j K L M N N 0 P MyEducator Tasks of Events 100 A B Product Type Cost of Goods Sold (C065 Commission Fixed Costs Employees of Expected Profit Salary (per employee Arena Fon 10% Attendance Programs C E Programs Food Merchandise 40% 60% 70% 20% 5% $5,000.CO $10,000.00 $20,000.00 $ 0.05% 0.20% 0.03% $50.00 $100,000.00 4 5 6 7. Merchandise Food 4 Statistic Average Standard Deviation 95% Confidence interval Which product generates the largest gross profit? Programs Food Merchandise Product Type Correlation with Attendance O Merchandise O Programs O Food Event ProfitabWty Analysis Attendance 18000 Gross Profit Programs Food Merchandise Product Type Programs Food Product Type Expected Sales Cost of Gands Sold (COGS Gross Profit Merchandise Sales Farerast Upper Limit for Sales Lower Limit for Sales 5 Which product will require a the fewest employees? Operating Expenses Programs Food Merchandise What If Analysis Product Type Salary Expenses Commissions Fixed Costs Total Operating Expenses Attendance 19000 15000 9 10 11 12 13 14 15 16 17 18 19 20 21 22 23 24 25 26 27 28 29 30 31 32 33 34 35 36 37 21000 O Merchandise O Programs O Food Profit before Arena Fee Arena Fee $50,000.00 $75,000.00 $100,000.00 $125,000.00 $150,000.00 $175,000.00 $200,000.00 Number of Employees 6 Profit Summary Tatal Item Total Expected Sales Total Gross Profit Total Operating Expenses Profit before Arena Fee Arena Fee Net Profit A event would be profitable with an arena fee of $150,000 If 15000 people were in attendance. O True O False AverageAttendance Total MerchSales Sporting Events Concerts FoodSales Trail Past Events Event Profit + Ready Add-ins loaded successfully !! - - 5 100% 45 APR 6 3 tv s 4 w Excel File Edit View Insert Format Tools Data Window Help a a 20 Wed Apr 6 4:14 PM AutoSave OFF MB2 C... Book3 Home Insert Draw Page Layout Formulas Data Review View Tell me Share Comments Calibri (Body) v 12 AA A = V O $ IL Number v Inwart Dk Delete Format ch IN Analyze Data Peste B OA + 3 $ 90 Conditional Format Formatting as Table Cell Styles Tasks Sort & Filter Sensil Vily Find & Select 16 X fc 7 M N 0 P MyEducator Tasks Event Profit Merchandise A B F F G H K K 1 2 Model Inputs Input Analysis 3 Product Type Programs Food Merchandise of Events 100 4 Cost of Goods Sold (COGS 40% 60% 70% 5 Commission 20 10% 5% Statistic Attendance Programs Food 6 Fixed Costs $5,000.co $10,000.00 $20,000.00 Average 7 Employees (% of Expected Profit 0.0SX 0.20% % 0.03% % Stardard Deviation 8 Salary (per employee) $50.00 $ 95% Confidence interval 9 Arena Fee $100,000.00 10 Product Type Programs Food Merchandise 11 Event Profitability Analysis Correlation with Attendance 12 13 Gross Profit Attendance 18000 14 Product Type Programs Food Merchandise 15 Expected Sales Product Type Programs Food Merchandise 16 Cost of Goods Sold (COGS Sales Forecast 17 Gross Profit Upper Limit for Sales 18 Lower Limit for Sales 19 Operating Expenses 20 Product Type Programs Food Merchandise What-il Analysis 21 Salary Expenses Attendance 22 Commissions 15000 18000 23 Fixed Costs $50,000.00 24 Total Operating Expenses $75,000.00 25 $100,000.00 26 Prafit before Arena Fue Arena Fee $125,000.00 27 $150,000.00 28 Nurnber of Employees $175,000.00 29 $200,000.00 30 Pratit Summary 31 Item Total 32 Total Expected Sales 33 Total Gross Profit 34 Total Operating Expenses 35 Profit before Arena Fcc AverageAttendance Total MerchSales Sporting Events Concerts FoodSales Trail Past Events Ready 21000 You are the owner of a small business that manages the program, food, and merchandise sales at the Excel Center, where the local professional basketball team plays. In addition to basketball games, the Excel Center hosts dozens of events a year. Your company handles all sales made inside the arena. There are three major products that you sell: programs, food, and merchandise. You have decided to build a spreadsheet model to help you analyze and project the profitability of future events. The 'Event Profit' worksheet contains this ma model. You have randomly selected sales and attendance data from a number of past events to help build your model. This data can be found on the on the 'Past Events' worksheet. You will complete statistics on this model to obtain appropriate values for the inputs for the model. Complete the tasks to finish the model. Whenever possible, Add-ins loaded successfully W - NA Event Profit + + 100% 45 APR 6 3 tv w Excel File Edit View Insert Format Tools Data Window Help a 80 a Wed Apr 6 4:15 PM AutoSave OFF MB2 C... Book3 Home Insert Draw Page Layout Formulas Data Review View Tell me Share W Comments Calibri (Body) v 12 AA A = V O sy Currency IL v Inwart Dk Delete Format Peste B OA + $ 3 % ) Conditional Format Formatting an Table Cell Styles Sort & Filter IN Analyze Data Tasks Find & Select Sensil Vily JB X fc 7 M N P MyEducator Tasks . for the model. Complete the tasks to finish the model. Whenever possible, reference cells rather than 'hard-coding values in the cells of your spreadsheet. Merchandise A B D F F G H K 1 2 Model Inputs Input Analysis 3 Product Type Programs Food Merchandise of Events 100 4 Cost of Goods Sold (COGS 40% 60% 70% 5 Commission 20 10% 5% Statistic Attendance Programs Food 6 Fixed Costs $5,000.co $10,000.00 $20,000.00 Average 7 7 Employees (% of Expected Profit 0.0SX 0.20% % 0.03% % Stardard Deviation Salary (per employee) $50.00 $ 95% Contidence interval 9 9 Arena Fee $100,000.00 10 Product Type Programs Food Merchandise 11 Event Profitability Analysis Correlation with Attendance 12 13 Gross Profit Attendance 18000 14 Product Type Programs Food Merchandise 15 Expected Sales Product Type Programs Food Merchandise 16 Cost of Goods Sold (COGS Sales Forecast 17 Gross Profit Upper Limit for Sales 18 Lower Limit for Sales 19 Operating Expenses 20 Product Type Programs Food Merchandise What-il Analysis 21 Salary Expenses Attendance 22 Commissions 15000 18000 23 Fixed Costs $50,000.00 24 Total Operating Expenses $75,000.00 25 $100,000.00 26 Prafit before Arena Fue Arena Fee $125,000.00 27 $150,000.00 28 Nurnber of Employees $175,000.00 29 $200,000.00 30 Pratit Summary 31 Item Total 32 Total Expected Sales 33 Total Gross Profit 34 Total Operating Expenses 35 Profit before Arena Fcc AverageAttendance Total MerchSales Sporting Events Concerts FoodSales Trail Past Events Ready 1.1 In the "Input Analysis" section of the spreadsheet model, use the past events listed on the "Past Events" worksheet to calculate the average attendance, and then the average sales for each type of product. 8 1.2 In the "Input Analysis" section of the spreadsheet model, calculate the sample standard deviation for attendance and sales for each type of product from the past events listed on the "Past Events" worksheet. 21000 8 (1.3) In the "Input Analysis" section 1.4 In the "Input Analysis" section (1.5 In the "Input Analysis" section 1.6 In the "Input Analysis" section Add-ins loaded successfully ) 0 - + 100% Event Profit + 45 APR 6 3 tv NA w Excel File Edit View Insert Format Tools Data Window Help a 80 Q8 Wed Apr 6 4:15 PM AutoSave OFF MB2 C... Book3 Home Insert Draw Page Layout Formulas Data Review View Tell me Share W Comments V v Peste Y Calibri (Body) v 12 AA A = O sy Inwart Currency IL Fan Dk Delete IN B OA + $ %) Conditional Format 90 3 Cell Sort & Find & Analyze Sensit Vily Tasks Formatting as Table Styles Format Filter Select Data 116 . X fc B F F G H K K M N 0 P MyEducator Tasks 1 1 2 Model Inputs Input Analysis 13 In the "Input Analysis" section 3 Product Type Programs Food Merchandise of Events 100 of the spreadsheet model, calculate the 4 Cost of Goods Sold (COGS 40% 60% 70% 5 Commission 20 10% 5% Statistic Attendance Programs Food Merchandise 95% confidence interval for the sales for 6 Fixed Costs $5,000.co $10,000.00 $20,000.00 Average each type of product. 7. Employees (% of Expected Profit 0.0SX 0.20% % 0.03% Stardard Deviation Salary (per employee) $50.00 $ 95% Contidence interval Notice that you will not calculate a 9 Arena Fee $100,000.00 confidence interval for attendance, 10 Product Type Programs Food Merchandise Reference the number of events in 11 Event Profitability Analysis Correlation with Attendance 12 cell 13) as part of your calculations. 13 Gross Profit Attendance 18000 14 Product Type Programs Food Merchandise (7.5 15 Expected Sales Product Type Programs Food Merchandise 16 Cost of Goods Sold (COGS Sales Forecast 17 1.4 In the "Input Analysis" section Gross Profit Upper Limit for Sales 18 Lower Limit for Sales of the spreadsheet model, calculate the 19 Operating Expenses correlations between the sales of each 20 Product Type Programs Food Merchandise What-il Analysis 21 Salary Expenses Attendance type of product and event attendance. 22 Commissions 15000 18000 21000 Use appropriate ranges from the 23 Fixed Costs $50,000.00 "Past Event" worksheet for your 24 Total Operating Expenses $75,000.00 25 $100,000.00 calculations. 26 Prafit before Arena Fue Arena Fee $125,000.00 27 $150,000.00 28 Nurnber of Employees $175,000.00 7.5 29 $200,000.00 Pratit Summary 1.5 In the "Input Analysis" section 30 31 Item Total of the spreadsheet model, calculate a 32 Total Expected Sales sales forecast for each type of product if 33 Total Gross Profit 34 Total Operating Expenses expected attendance at the future event 35 Profit before Arena Fcc is 18000 people. AverageAttendance Total MerchSales Sporting Events Concerts FoodSales Trail Past Events Event Profit + Reference cell 113) (the attendance Ready Add-ins loaded successfully U 0 + 100% 45 APR 6 tv NA w 3 Excel File Edit View Insert Format Tools Data Window Help a 80 Q8 Wed Apr 6 4:15 PM AutoSave OFF MB2 C... Book3 Home Insert Draw Page Layout Formulas Data Review View Tell me Share W Comments V Inwart Dk Delete Format ch IN Analyze Data Peste Sort & & Filter Find & Select Sensil Vily Tasks 0 P MyEducator Tasks 23 sales forecast for each type of product expected attendance at the future event is 18000 people. Reference cell 113, (the attendance forecast) for your calculations. Attendance Calibri (Body) v 12 AA A = O sy Currency IL v B OA + 3 $ %) Conditional Format 90 Cell Formatting as Table Styles 118 X fc A B F F G H K M N 1 2 Model Inputs Input Analysis 3 Product Type Programs Food Merchandise of Events 100 4 Cost of Goods Sold (COGS 40% 60% 70% 5 Commission 20 10% 5% Statistic Programs Food Merchandise 6 Fixed Costs $5,000.co $10,000.00 $20,000.00 Average 7. Employees (% of Expected Profit 0.0SX 0.20% % 0.03% % Stardard Deviation Salary (per employee) $50.00 $ 95% Contidence interval 9 Arena Fee $100,000.00 10 Product Type Programs Food Merchandise 11 Event Profitability Analysis Correlation with Attendance 12 13 Gross Profit Attendance 18000 14 Product Type Programs Food Merchandise 15 Expected Sales Product Type Programs Food Merchandise 16 Cost of Goods Sold (COGS Sales Forecast 17 Gross Profit Upper Limit for Sales 18| LON'er Limit for Sales 19 Operating Expenses 20 Product Type Programs Food Merchandise What-il Analysis 21 Salary Expenses Attendance 22 Commissions 15000 18000 21000 23 Fixed Costs $50,000.00 24 Total Operating Expenses $75,000.00 25 $100,000.00 26 Prafit before Arena Fue Arena Fee $125,000.00 27 $150,000.00 28 Nurnber of Employees $175,000.00 29 $200,000.00 30 Pratit Summary 31 Item Total 32 Total Expected Sales 33 Total Gross Profit 34 Total Operating Expenses 35 Profit before Arena Fcc AverageAttendance Total MerchSales Sporting Events Concerts FoodSales Trail Past Events Event Profit + Ready 16 1.6 In the "Input Analysis" section of the spreadsheet model, calculate the upper limit for your sales forecast for each type of product if expected attendance at the future event is 18000 people. Reference the confidence interval you created for your calculation. 6 1.7 In the "Input Analysis" section of the spreadsheet model, calculate the lower limit for your sales forecast for each type of product if expected attendance at the future event is 18000 people, Reference the confidence interval you created for your calculation. Add-ins loaded successfully 3 0 - - 100% 45 APR 6 3 tv NA w SA Excel File Edit View Insert Format Tools Data Window Help a 80 a Wed Apr 6 4:15 PM AutoSave OFF MB2 C... Book3 Home Insert Draw Page Layout Formulas Data Review View Tell me Share W Comments Calibri (Body) v 12 AA A = V O $ Currency IL v Inwart Dk Delete Format ch IN Analyze Data Paste B TU OA 3 + $ %) Conditional Format Formatting an Table Cell Styles Sort & Filter Tasks Sensit Vily Find & Select C17 . X fc M N 0 P X MyEducator Tasks 1.8 In the "Event Profitability Analysis" section of the model, enter the expected sales for each product type for this event by referencing your sales forecast from the "Input Analysis" section of the model. Merchandise 6 B c n F F G H K K 1 2 Model imputs Input Analysis 3 Product Type Programs Food Merchandise of Events 100 4 Cost of Goods Sold (COGS 40% 60% 70% 5 Commission 20 10% 5% Statistic Attendance Program: Food 6 Fixed Costs $5,000.co $10,000.00 $20,000.00 Average 7. Employees (% of Expected Profit 0.0SX 0.20% % 0.03% % Stardard Deviation Salary (per employee) $50.00 $ 95% Contidence interval 9 Arena Fee $100,000.00 10 Product Type Programs Food Merchandise 11 Event Profitability Analysis Correlation with Attendance 12 13 Gross Profit Attendance 18000 14 Product Type Programs Food Merchandise 15 Expected Sales Product Type Programs Food Merchandise 16 Cost of Goods Sold (COGS) Sales Forecast 17. Gross Profit Upper Limit for Sales 18 Lower Limit for Sales 19 Operating Expenses 20 Product Type Programs Food Merchandise What-il Analysis 21 Salary Expenses Attendance 22 Commissions 15000 18000 23 Fixed Costs $50,000.00 24 Total Operating Expenses $75,000.00 25 $100,000.00 26 Prafit before Arena Fue Arena Fee $125,000.00 27 $150,000.00 28 Nurnber of Employees $175,000.00 29 $200,000.00 30 Pratit Summary 31 Item Total 32 Total Expected Sales 33 Total Gross Profit 34 Total Operating Expenses 35 Profit before Arena Fcc AverageAttendance Total MerchSales Sporting Events Concerts FoodSales Trail Past Events Ready 1.9 Calculate the cost of goods sold (COGS) for each product. The COGS is calculated as the expected sales for each product type times the COGS percentage from the "Model Inputs" section of the model for that product type. 21000 6 1.10 Calculate the Gross Profit for each product. The gross profit is calculated as the expected sales minus the COGS for each product. 6 1.11 Calculate the Commissions Event Profit + Add-ins loaded successfully 11 ! 0 + 100% 45 APR 6 3 tv NA w Excel File Edit View Insert Format Tools Data Window Help a 80 O Wed Apr 6 4:15 PM AutoSave OFF MB2 C... Book3 Home Insert Draw Page Layout Formulas Data Review View Tell me Share W Comments Calibri (Body) v 12 AA A = V O $ Currency IL v Inwart Dk Delete Format ch IN Analyze Data Paste B TU 3 OA + $ %) Conditional Format Formatting an Table Cell Styles Sort & Filter Sensil vity Find & Select C24 X fc M N P MyEducator Tasks Merchandise 1.11 Calculate the Commissions paid for each product type. The commissions paid are calculated as the expected sales for each product type times the commission % from the "Model Inputs" section of the model. 6 A B c n F F G H K K 1 2 Model imputs Input Analysis 3 Product Type Programs Food Merchandise of Events 100 4 Cost of Goods Sold (COGS 40% 60% 70% 5 Commission 20 10% 5% Statistic Attendance Program: Food 6 Fixed Costs $5,000.co $10,000.00 $20,000.00 Average 7. Employees (% of Expected Profit 0.0SX 0.20% % 0.03% Stardard Deviation Salary (per employee) $50.00 $ 95% Contidence interval 9 Arena Fee $100,000.00 10 Product Type Programs Food Merchandise 11 Event Profitability Analysis Correlation with Attendance 12 13 Gross Profit Attendance 18000 14 Product Type Programs Food Merchandise 15 Expected Sales Product Type Programs Food Merchandise 16 Cost of Goods Sold (COGS Sales Forecast 17 Gross Profit Upper Limit for Sales 18 Lower Limit for Sales 19 Operating Expenses 20 Product Type Programs Food Merchandise What-il Analysis 21 Salary Expenses Attendance 22 Commissions 15000 18000 23 Fixed Costs $50,000.00 24 Total Operating Expenses $75,000.00 25 $100,000.00 26 Prafit before Arena Fue Arena Fee $125,000.00 27 $150,000.00 28 Nurnber of Employees $175,000.00 29 $200,000.00 30 Pratit Summary 31 Item Total 32 Total Expected Sales 33 Total Gross Profit 34 Total Operating Expenses 35 Profit before Arena Fcc AverageAttendance Total MerchSales Sporting Events Concerts FoodSales Trail Past Events Ready 1.12 Enter the fixed costs for the model Reference the Fixed Costs for each product type from the "Model Inputs" section of the model 21000 6 1.13 Calculate the total operating expenses for each product type. . This is the sum of Salary Expenses (which you have not yet calculated), Commissions, and the Fixed Costs for each product type. 6 Event Profit + Add-ins loaded successfully !!! 10 - O + 100% 45 APR 6 3 tv NA w Excel File Edit View Insert Format Tools Data Window Help a 80 a Wed Apr 6 4:16 PM AutoSave OFF MB C... Book3 Home Insert Draw Page Layout Formulas Data Review View Tell me Share Comments Calibri (Body) v 12 AA A = V O $ Number IL ch v Inwart Dk Delete Format Peste B TU OA 3 + $ 90 Cell Styles Conditional Format Formatting an Table Sort & & Filter Sensil vity Find & Select Tasks Analyze Data C28 X fc B c n F F G H K M N P MyEducator Tasks X 6 Input Analysis 100 of Events 1 2 3 4 5 6 7. Attendance Programs Food Merchandise Model imputs Product Type Programs Food Merchandise Cost of Goods Sold (COGS 40% 60% 70% Commission 20 10% 5% Fixed Costs $5,000.co $10,000.00 $20,000.00 Employees (% of Expected Profit 0.0SX 0.20% % 0.03% Salary (per employee) $50.00 $ Arena Fee $100,000.00 Statistic Average Stardard Deviation 95% Contidence interval 1.14 Calculate the Profit before Arena Fee for each product type. This is the Gross Profit minus the Total Operating Expenses (including Salary Expenses - which you have not yet calculated) for each type of product. Programs Food Merchandise Product Type Correlation with Attendance Event Profitability Analysis Attendance 18000 Gross Profit Programs Food Merchandise Programs Food Merchandise Product Type Expected Sales Cost of Goods Sold (COGS Gross Profit Product Type Sales Forecast Upper Limit for Sales Lower Limit for Sales Operating Expenses Programs Food Merchandise What-il Analysis 9 10 11 12 13 14 15 16 17 18 19 20 21 22 23 24 25 26 27 28 29 30 31 32 33 34 35 Product Type Salary Expenses Commissions Fixed Costs Total Operating Expenses Attendance 18000 15000 21000 6 1.15 Calculate the number of employees needed to work the event for each type of product This is calculated as the Profit carca.com Before Arena Fee for each type of . product times the Employees (% of Expected Profit) for each product type from the model inputs. Since you can't hire a fraction of an employee, be sure to round your calculations up to the next whole employee. Prafit before Arena Fue $50,000.00 $75,000.00 $100,000.00 $125,000.00 $150,000.00 $175,000.00 $200,000.00 Arena Fee Number of Employees Profit Summary Total Item Total Expected Sales Total Gross Profit Total Operating Expenses Prafit before Arena Fee 6 AverageAttendance Total MerchSales Sporting Events Concerts FoodSales Trail Past Events Event Profit + (116 calculate the Salan, Evnanses Add-ins loaded successfully ! 0 U -- + 100% Ready 45 APR 6 3 tv NA w Excel File Edit View Insert Format Tools Data Window Help a 80 O Wed Apr 6 4:16 PM AutoSave or OFF MB2 C... Book3 Home Insert Draw Page Layout Formulas Data Review View Tell me Share W Comments Calibri (Body) v 12 AA A = V O . $ Currency IL v Inwart Dk Delete Format ch IN Analyze Data B TU 3 OA + $ %) Conditional Format Formatting an Table Cell Styles Sort & Filter Find & Select Sensitvity C32 . X fc M N 0 P MyEducator Tasks 6 Merchandise B c n F F G H K K 1 2 Model imputs Input Analysis 3 Product Type Programs Food Merchandise of Events 100 4 Cost of Goods Sold (COGS 40% 60% 70% 5 Commission 20 10% 5% Statistic Attendance Program: Food 6 Fixed Costs $5,000.co $10,000.00 $20,000.00 Average 7. Employees (% of Expected Profit 0.0SX 0.20% % 0.03% Stardard Deviation Salary (per employee) $50.00 $ 95% Contidence interval 9 Arena Fee $100,000.00 10 Product Type Programs Food Merchandise 11 Event Profitability Analysis Correlation with Attendance 12 13 Gross Profit Attendance 18000 14 Product Type Programs Food Merchandise 15 Expected Sales Product Type Programs Food Merchandise 16 Cost of Goods Sold (COGS Sales Forecast 17 Gross Profit Upper Limit for Sales 18 Lower Limit for Sales 19 Operating Expenses 20 Product Type Programs Food Merchandise What-il Analysis 21 Salary Expenses Attendance 22 Commissions 15000 18000 23 Fixed Costs $50,000.00 24 Total Operating Expenses $75,000.00 25 $100,000.00 26 Prafit before Arena Fue Arena Fee $125,000.00 27 $150,000.00 28 Nurnber of Employees $175,000.00 29 $200,000.00 30 31 Item Total 32 | Total Expected Sales 33 Total Gross Profit 34 Total Operating Expenses 35 Profit before Arena Fcc AverageAttendance Total MerchSales Sporting Events Concerts FoodSales Trail Past Events Ready 1.16 Calculate the Salary Expenses A for each product type. This is calculated as the number of employees needed for each product type times the Salary(per employee) in the model inputs (employees make the same salary despite the product type). . Note that this will create a circular reference in your spreadsheet. You will need to change the options in Excel to appropriately account for the circular reference. 21000 Profit Summary 6 1.17 In the Profit Summary section of the worksheet, calculate the total expected sales for all products by referencing the Expected Sales for each product in the Gross Profit section. 2 (1.18 In the Profit Summary section - ( (119) Complete the total narating A Add-ins loaded successfully? - 0 100% Event Profit + + 45 APR 6 3 tv NA w Excel File Edit View Insert Format Tools Data Window Help O Wed Apr 6 4:16 PM AutoSave OFF MB C... Book3 Home Insert Draw Page Layout Formulas Data Review View Tell me Share Comments Calibri (Body) v 12 AA A = V O Currency IL (ch) v Inwart Dk Delete Format Peste B TU OA 3 + $ % ) Conditional Format Formatting an Table Cell Styles Taska Sort & Filter Find & Select Sensit Vily Analyze Data C33 . X fc M N 0 P MyEducator Tasks Merchandise A B c n F F G H K K 1 2 Model imputs Input Analysis 3 Product Type Programs Food Merchandise of Events 100 4 Cost of Goods Sold (COGS 40% 60% 70% 5 Commission 20 10% 5% Statistic Attendance Program: Food 6 Fixed Costs $5,000.co $10,000.00 $20,000.00 Average 7. Employees (% of Expected Profit 0.05% 0.20% % 0.03% Stardard Deviation Salary (per employee) $50.00 $ 95% Contidence interval 9 Arena Fee $100,000.00 10 Product Type Programs Food Merchandise 11 Event Profitability Analysis Correlation with Attendance 12 13 Gross Profit Attendance 18000 14 Product Type Programs Food Merchandise 15 Expected Sales Product Type Programs Food Merchandise 16 Cost of Goods Sold (COGS Sales Forecast 17 Gross Profit Upper Limit for Sales 18 Lower Limit for Sales 19 Operating Expenses 20 Product Type Programs Food Merchandise What-il Analysis 21 Salary Expenses Attendance 22 Commissions 15000 18000 23 Fixed Costs $50,000.00 24 Total Operating Expenses $75,000.00 25 $100,000.00 26 Prafit before Arena Fue Arena Fee $125,000.00 27 $150,000.00 28 Nurnber of Employees $175,000.00 29 $200,000.00 30 Profit Summary 31 Item Total 32 Total Expected Sales 33 Total Gross Profit 34 Total Operating Expenses 35 Prafit before Arena Fee AverageAttendance Total MerchSales Sporting Events Concerts FoodSales Trail Past Events Ready 1.18 In the Profit Summary section of the worksheet, calculate the total gross profit for all products by referencing the Gross Profit for each product in the Gross Profit section. 2 1.19 Complete the Total Operating Expenses portion of the Profit Summary section of the worksheet by calculating the Total Operating Expenses for all products from the Operating Expenses section of the model. 2 1.20 Complete the Profit before Arena Fee portion of the Profit Summary section of the worksheet by calculating the Total Profit before Arena Fee for all products from the Operating Expenses section of the model. 2 1.21 Complete the Arena Fee 1.22 Calculate the Net Profit 21000 Event Profit + Add-ins loaded successfully 5 - + 100% 45 APR 6 3 tv NA w Excel File Edit View Insert Format Tools Data Window Help O Wed Apr 6 4:16 PM AutoSave or OFF MB2 C... Book3 Home Insert Draw Page Layout Formulas Data Review View Tell me Share - Comments Calibri (Body) v 12 AA A = Oy $9 Currency IL (ch) v Inwart DX Delete Format Peste B TU 11 3 OA + $ % ) Conditional Format Formatting as Table Cell Styles Sort & & Filter Find & Select Tasks Sensit Vily Analyze Data 122 X fc F G H j K L M N 0 P of Events 100 10% Attendance Programs A B Product Type Cost of Goods Sold (C065 Commission Fixed Costs Employees of Expected Profit Salary (per employee Arena Fon 4 5 6 7. Merchandise C E Programs Food Merchandise 40% 60% 70% 20% 5% $5,000.CO $10,000.00 $20,000.00 $ 0.05% 0.20% 0.03% $50.00 $100,000.00 Food Statistic Average Standard Deviation 95% Confidence interval Programs Food Merchandise Product Type Correlation with Attendance Event ProfitabWty Analysis Attendance 18000 Gross Profit Programs Food Merchandise Product Type Programs Food Product Type Expected Sales Cost of Gands Sold (COGS Gross Profit Merchandise Sales Farerast Upper Limit for Sales Lower Limit for Sales MyEducator Tasks section of the worksheet by calculating the Total Profit before Arena Fee for all products from the Operating Expenses section of the model. 2 1.21 Complete the Arena Fee portion of the Profit Summary section of the model by referencing the Arena fee from the Model Inputs. 2 1.22 Calculate the Net Profit portion of the Profit Summary section of the model by subtracting the Arena Fee from the Profit before Arena Fee. 2 (1.23) Complete the data table in the "What-if Analysis" section of the worksheet to compute the Net Profit for various values of attendance and the Arena Fee. 20 Operating Expenses Programs Food Merchandise What If Analysis Product Type Salary Expenses Commissions Fixed Costs Total Operating Expenses Attendance 19000 9 10 11 12 13 14 15 16 17 18 19 20 21 22 23 24 25 26 27 28 29 30 31 32 33 34 35 36 37 15000 21000 Profit before Arena Fee Arena Fee $50,000.00 $75,000.00 $100,000.00 $125,000.00 $150,000.00 $175,000.00 $200,000.00 Number of Employees Profit Summary Tatal Item Total Expected Sales Total Gross Profit Total Operating Expenses Profit before Arena Fee Arena Fee Net Profit AverageAttendance Total MerchSales Sporting Events Concerts FoodSales Trail Past Events Event Profit + Ready Add-ins loaded successfully !! - - 5 + 100% 45 APR 6 3 tv s 4 w Excel File Edit View Insert Format Tools Data Window Help a O Wed Apr 6 4:16 PM AutoSave or OFF MB2 C... Book3 Home Insert Draw Page Layout Formulas Data Review View Tell me A Share Comments Calibri (Body) v 12 AA A = Oy $9 Currency IL (ch) v Inwart DX Delete Format Peste B TU 11 3 OA + $ % ) Taska Conditional Format Formatting as Table Cell Styles Sort & Filter Find & Select Sensitivity Analyze Data 122 X fc F G H j K L M N 0 P MyEducator Tasks of Events 100 10% Attendance Programs A B Product Type Cost of Goods Sold (C065 Commission Fixed Costs Employees of Expected Profit Salary (per employee Arena Fon 4 5 6 7. Merchandise C E Programs Food Merchandise 40% 60% 70% 20% 5% $5,000.CO $10,000.00 $20,000.00 $ 0.05% 0.20% 0.03% $50.00 $100,000.00 Food Statistic Average Standard Deviation 95% Confidence interval 2) The sales for which product type are most highly correlated with attendance? Programs Food Merchandise Product Type Correlation with Attendance Event ProfitabWty Analysis Attendance 18000 Gross Profit Programs O Merchandise O Food O Programs Food Merchandise Product Type Programs Food Product Type Expected Sales Cost of Gands Sold (COGS Gross Profit Merchandise Sales Farerast Upper Limit for Sales Lower Limit for Sales Operating Expenses Programs Food Merchandise What If Analysis 3 Product Type Salary Expenses Commissions Fixed Costs Total Operating Expenses Attendance 19000 9 10 11 12 13 14 15 16 17 18 19 20 21 22 23 24 25 26 27 28 29 30 31 32 33 34 35 36 37 How likely is it that food sales would exceed $220,000 if attendance is 18000? 15000 21000 Profit before Arena Fee Arena Fee $50,000.00 $75,000.00 $100,000.00 $125,000.00 $150,000.00 $175,000.00 $200,000.00 Number of Employees Profit Summary Tatal O Less than a 5% chance a 5 O Greater than a 5% chance About a 50% chance O Greater than a 95% chance O It is impossible to say Item Total Expected Sales Total Gross Profit Total Operating Expenses Profit before Arena Fee Arena Fee Net Profit AverageAttendance Total MerchSales Sporting Events Concerts FoodSales Trail Past Events Event Profit + Ready Add-ins loaded successfully 1 - - 100% 45 APR 6 3 tv NA w Excel File Edit View Insert Format Tools Data Window Help O Wed Apr 6 4:17 PM AutoSave or OFF MB2 C... Book3 Home Insert Draw Page Layout Formulas Data Review View Tell me Share - Comments Calibri (Body) v 12 AA A = Oy $9 Currency IL (ch) v Inwart Dk Delete Format Peste B TU 11 3 OA + $ % ) Conditional Format Formatting as Table Cell Styles Sort & Filter Find & Select Sensitivity Analyze Data Tasks 122 X fc F G H j K L M N N 0 P MyEducator Tasks of Events 100 A B Product Type Cost of Goods Sold (C065 Commission Fixed Costs Employees of Expected Profit Salary (per employee Arena Fon 10% Attendance Programs C E Programs Food Merchandise 40% 60% 70% 20% 5% $5,000.CO $10,000.00 $20,000.00 $ 0.05% 0.20% 0.03% $50.00 $100,000.00 4 5 6 7. Merchandise Food 4 Statistic Average Standard Deviation 95% Confidence interval Which product generates the largest gross profit? Programs Food Merchandise Product Type Correlation with Attendance O Merchandise O Programs O Food Event ProfitabWty Analysis Attendance 18000 Gross Profit Programs Food Merchandise Product Type Programs Food Product Type Expected Sales Cost of Gands Sold (COGS Gross Profit Merchandise Sales Farerast Upper Limit for Sales Lower Limit for Sales 5 Which product will require a the fewest employees? Operating Expenses Programs Food Merchandise What If Analysis Product Type Salary Expenses Commissions Fixed Costs Total Operating Expenses Attendance 19000 15000 9 10 11 12 13 14 15 16 17 18 19 20 21 22 23 24 25 26 27 28 29 30 31 32 33 34 35 36 37 21000 O Merchandise O Programs O Food Profit before Arena Fee Arena Fee $50,000.00 $75,000.00 $100,000.00 $125,000.00 $150,000.00 $175,000.00 $200,000.00 Number of Employees 6 Profit Summary Tatal Item Total Expected Sales Total Gross Profit Total Operating Expenses Profit before Arena Fee Arena Fee Net Profit A event would be profitable with an arena fee of $150,000 If 15000 people were in attendance. O True O False AverageAttendance Total MerchSales Sporting Events Concerts FoodSales Trail Past Events Event Profit + Ready Add-ins loaded successfully !! - - 5 100% 45 APR 6 3 tv s 4 w
Step by Step Solution
There are 3 Steps involved in it

Get step-by-step solutions from verified subject matter experts