

Question: Please provide any necessary commons, thanks. Create two m-files i. The first m-file will have an input columnvector r and an output column vector y
 Please provide any necessary commons, thanks.
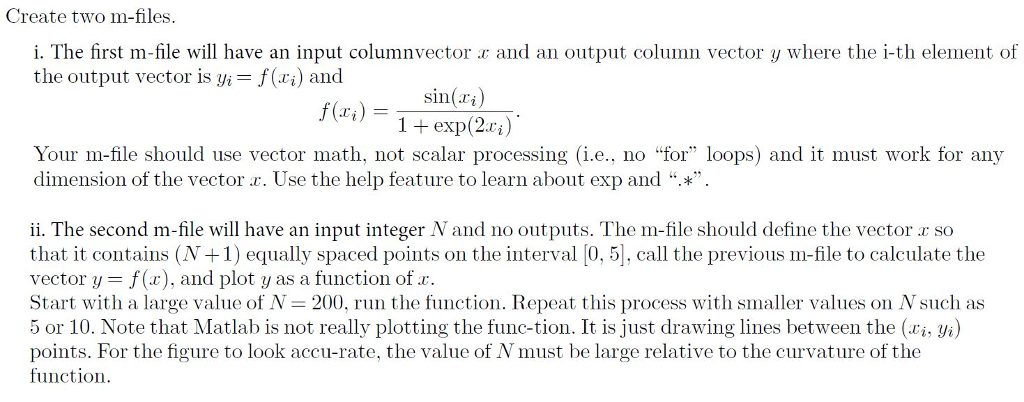
Create two m-files i. The first m-file will have an input columnvector r and an output column vector y where the i-th element of the output vector is yi f(i) and sin i) 1exp(2ri) Your m-file should use vector math, not scalar processing (i.e., no "for" loops) and it must work for any dimension of the vector r. Use the help feature to learn about exp and "*" ii. The second m-file will have an input integer N and no outputs. The m-file should define the vector r so that it contains (N+1) equally spaced points on the interval [0, 5], call the previous m-file to calculate the vector y = f(z), and plot y as a function of a. Start with a large value of N-200, run the function. Repeat this process with smaller values on N such as 5 or 10. Note that Matlab is not really plotting the func-tion. It is just drawing lines between the (ti, vi) points. For the figure to look accu-rate, the value of N must be large relative to the curvature of the function
Step by Step Solution
There are 3 Steps involved in it

Get step-by-step solutions from verified subject matter experts