

Question: PLEASE PROVIDE DETAIL SOLUTION STEP BY STEP ALSO PROVIDE THE MATLAB CODE WITH EXAPLANATION FOR THE REQUIRED GRAPH. WARNING: IF YOU DONT KNOW THE SOLUTION
PLEASE PROVIDE DETAIL SOLUTION STEP BY STEP
ALSO PROVIDE THE MATLAB CODE WITH EXAPLANATION FOR THE REQUIRED GRAPH.
WARNING: IF YOU DONT KNOW THE SOLUTION ...LET SOMEONE ELSE SOLVE.....TO AVOID DOWNVOTE
THANKS
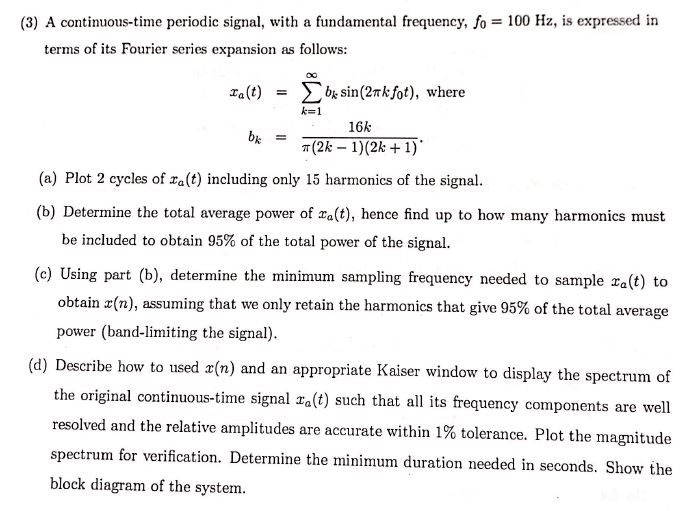
(3) A continuous-time periodic signal, with a fundamental frequency, fo = 100 Hz, is expressed in terms of its Fourier series expansion as follows: falt) = Sok sin(2k fot), where k=1 16k bk +(2k-1)(2k +1) (a) Plot 2 cycles of xa(t) including only 15 harmonics of the signal. (b) Determine the total average power of valt), hence find up to how many harmonics must be included to obtain 95% of the total power of the signal. (c) Using part (b), determine the minimum sampling frequency needed to sample ra(t) to obtain x(n), assuming that we only retain the harmonics that give 95% of the total average power (band-limiting the signal). (d) Describe how to used x(n) and an appropriate Kaiser window to display the spectrum of the original continuous-time signal Ia(t) such that all its frequency components are well resolved and the relative amplitudes are accurate within 1% tolerance. Plot the magnitude spectrum for verification. Determine the minimum duration needed in seconds. Show the block diagram of the system. (3) A continuous-time periodic signal, with a fundamental frequency, fo = 100 Hz, is expressed in terms of its Fourier series expansion as follows: falt) = Sok sin(2k fot), where k=1 16k bk +(2k-1)(2k +1) (a) Plot 2 cycles of xa(t) including only 15 harmonics of the signal. (b) Determine the total average power of valt), hence find up to how many harmonics must be included to obtain 95% of the total power of the signal. (c) Using part (b), determine the minimum sampling frequency needed to sample ra(t) to obtain x(n), assuming that we only retain the harmonics that give 95% of the total average power (band-limiting the signal). (d) Describe how to used x(n) and an appropriate Kaiser window to display the spectrum of the original continuous-time signal Ia(t) such that all its frequency components are well resolved and the relative amplitudes are accurate within 1% tolerance. Plot the magnitude spectrum for verification. Determine the minimum duration needed in seconds. Show the block diagram of the system
Step by Step Solution
There are 3 Steps involved in it

Get step-by-step solutions from verified subject matter experts