

Question: please provide example in excel format and any needed calculations and formula 1. Think of a simple process that you observe/do at work or at
please provide example in excel format and 
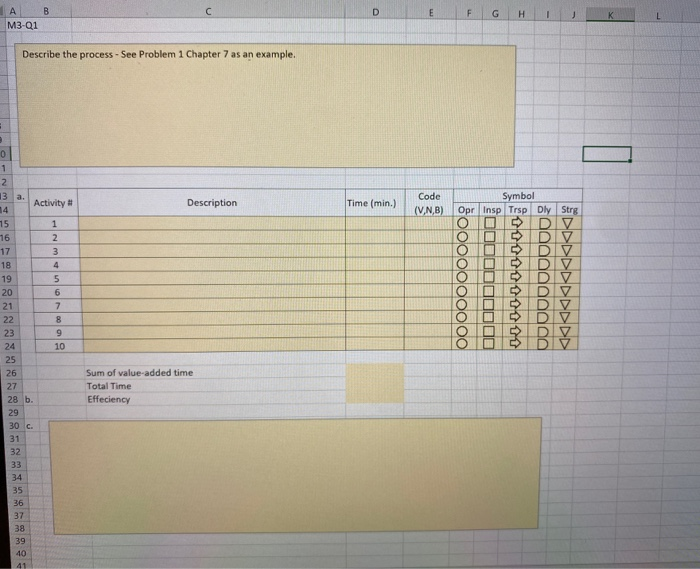
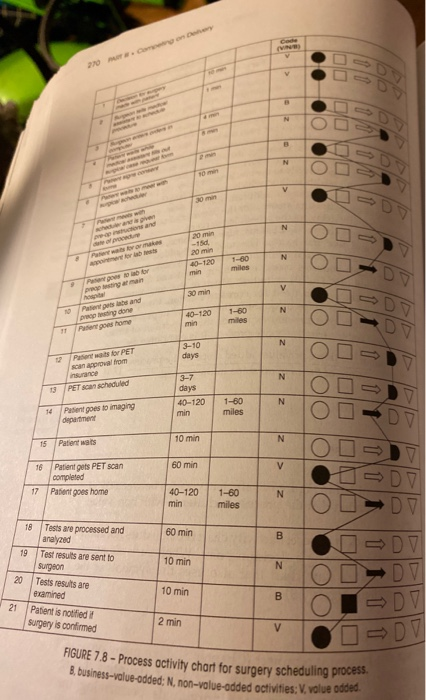
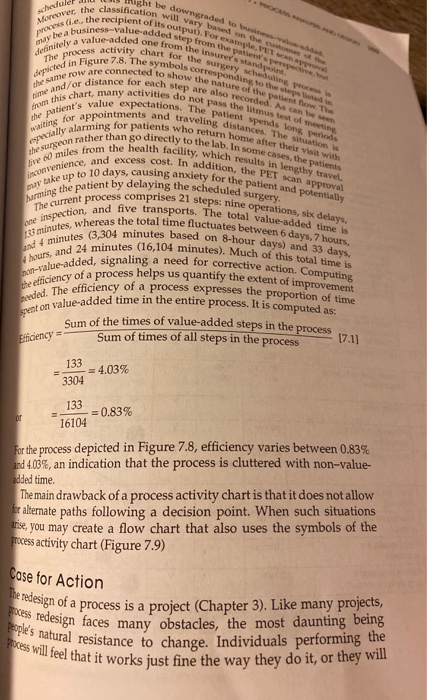
1. Think of a simple process that you observe/do at work or at home. a) Make a process activity chart to depict the process. See Figure 7.8 on page 270 of the textbook for an example of a process chart. b) Calculate the efficiency of the process. c) Suggest improvements to increase the efficiency of the process. B D E F G A M3-Q1 1 K Describe the process - See Problem 1 Chapter 7 as an example, 0 1 2 13 a. Activity # Description Time (min.) Code (V.N,B) Symbol Opr Insp Trsp Dly Strg 14 15 16 17 Solo DDV 18 1 2 3 4 5 6 7 DV nnnnnnn 8 9 10 19 20 21 22 23 24 25 26 27 28 b. 29 30 c. 31 32 33 34 35 Sum of value-added time Total Time Effeciency 36 37 38 39 40 41 FIGURE 7.8 - Process activity chart for surgery scheduling process 20. Cory N N v an N 20 min -10 worm - N 40-120 1-60 miles O O OO OLD V par man 30 min N Papa and cone Punt home 40-120 miles 11 N days Parts for PET napoval from N PET can scheduled 3-7 days 40-120 min N 1-60 miles OIO 1 / 1 Patient goes to imaging department 14 D 10 min N 15 Patient waits O V 16 60 min V Patient gets PET scan completed Patient goes home 17 40-120 min N 1-60 miles DV 60 min B 10 min N 18 Tests are processed and analyzed 19 Test results are sent to surgeon 20 Tests results are examined 21 Patient is notfied surgery is confirmed - DV DV DV 10 min B 2 min V 8, business-value-added: N, non-value-added activities:V, volue oddeo. be downgraded to business schedule Moreover, the classification will vary based on the Assie, the recipient of its output). For example, VET deinitely a value-added one from the insures standpoint be a business-value-added step from the patient's perspect The process activity chart for the surgery schedules, proces the same row are connected to show the nature of the patient tow. The depicted in Figure 7.8. The symbols corresponding to the wesen thom this chart, many activities do not pass the mus test of me e and/or distance for each step are also recorded. As can be waiting for appointments and traveling distances. The situations the patient's value expectations. The patient spends long periods the surgeon rather than go directly to the lab. In some cases, the patients especially alarming for patients who return home after the visit with venience, and excess cost. In addition, the PET scan approval 0 miles from the health facility, which results in lengthy travel, harming the patient by delaying the scheduled surgery. may take up to 10 days, causing anxiety for the patient and potentially The current process comprises 21 steps: nine operations, six delays. 133 minutes, whereas the total time fluctuates between 6 days, 7 hours, ome inspection, and five transports. The total value-added time is und 4 minutes (3,304 minutes based on 8-hour days) and 33 days, 4 hours, and 24 minutes (16,104 minutes). Much of this total time is the efficiency of a process helps us quantify the extent of improvement panded. The efficiency of a process expresses the proportion of time non-value-added, signaling a need for corrective action. Computing spent on value-added time in the entire process. It is computed as: The redesign of a process is a project (Chapter 3). Like many projects, process redesign faces many obstacles, the most daunting being people's natural resistance to change. Individuals performing the process will feel that it works just fine the way they do it, or they will Sum of the times of value-added steps in the Sum of times of all steps in the process process Eticiency 17.1) 133 = 4.03% 3304 133 16104 = 0.83% or For the process depicted in Figure 7.8, efficiency varies between 0.83% and 4.03%, an indication that the process is cluttered with non-value- added time The main drawback of a process activity chart is that it does not allow for alternate paths following a decision point. When such situations irise, you may create a flow chart that also uses the symbols of the process activity chart (Figure 7.9) Case for Action any needed calculations and formula
Step by Step Solution
There are 3 Steps involved in it
1 Expert Approved Answer
Step: 1 Unlock

Question Has Been Solved by an Expert!
Get step-by-step solutions from verified subject matter experts
Step: 2 Unlock
Step: 3 Unlock