Question: please do it in excel and upload it to google drive i just need to hand in the work today before 9 and i dont
please do it in excel and upload it to google drive i just need to hand in the work today before 9 and i dont have time thanks in advance
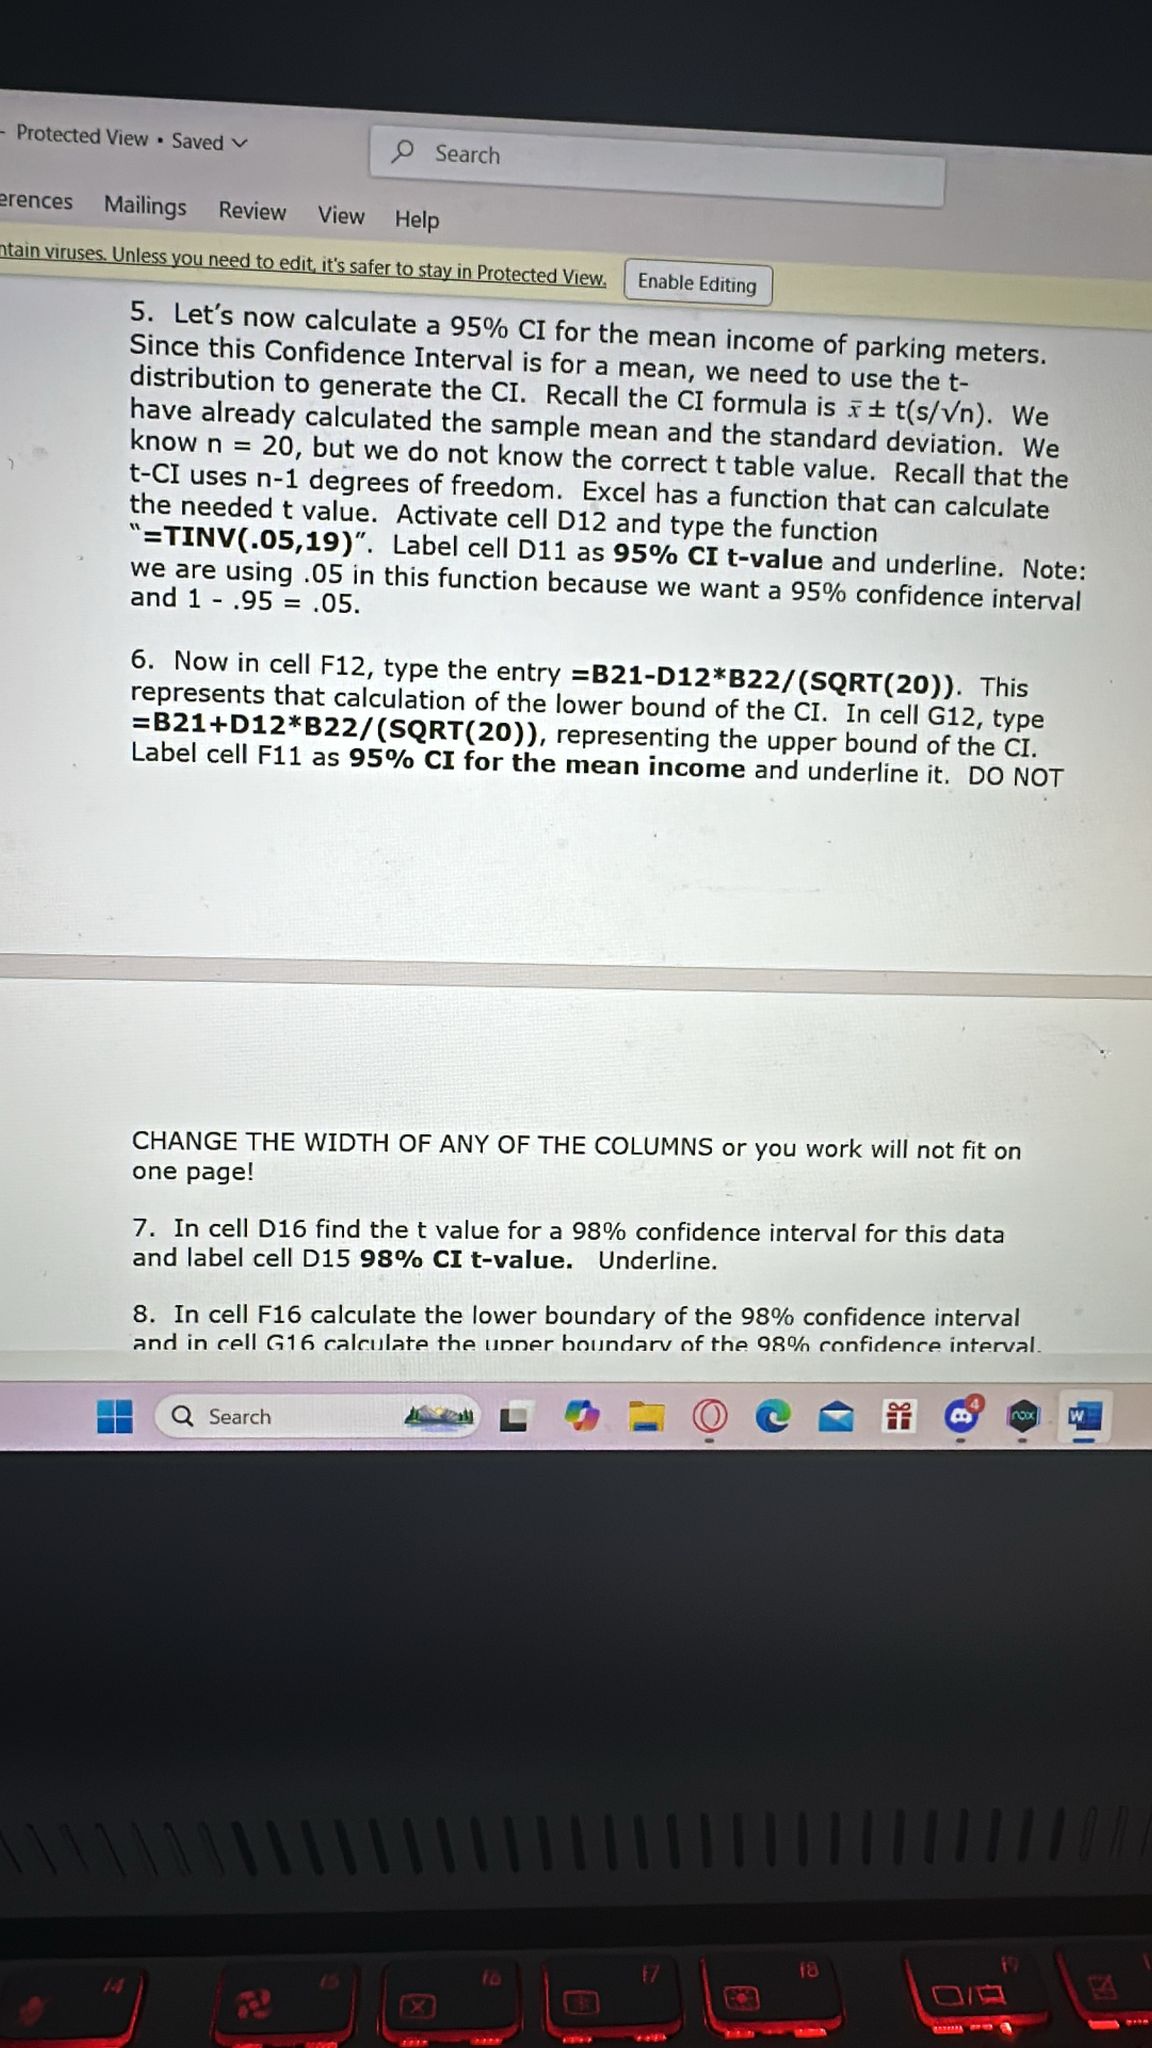
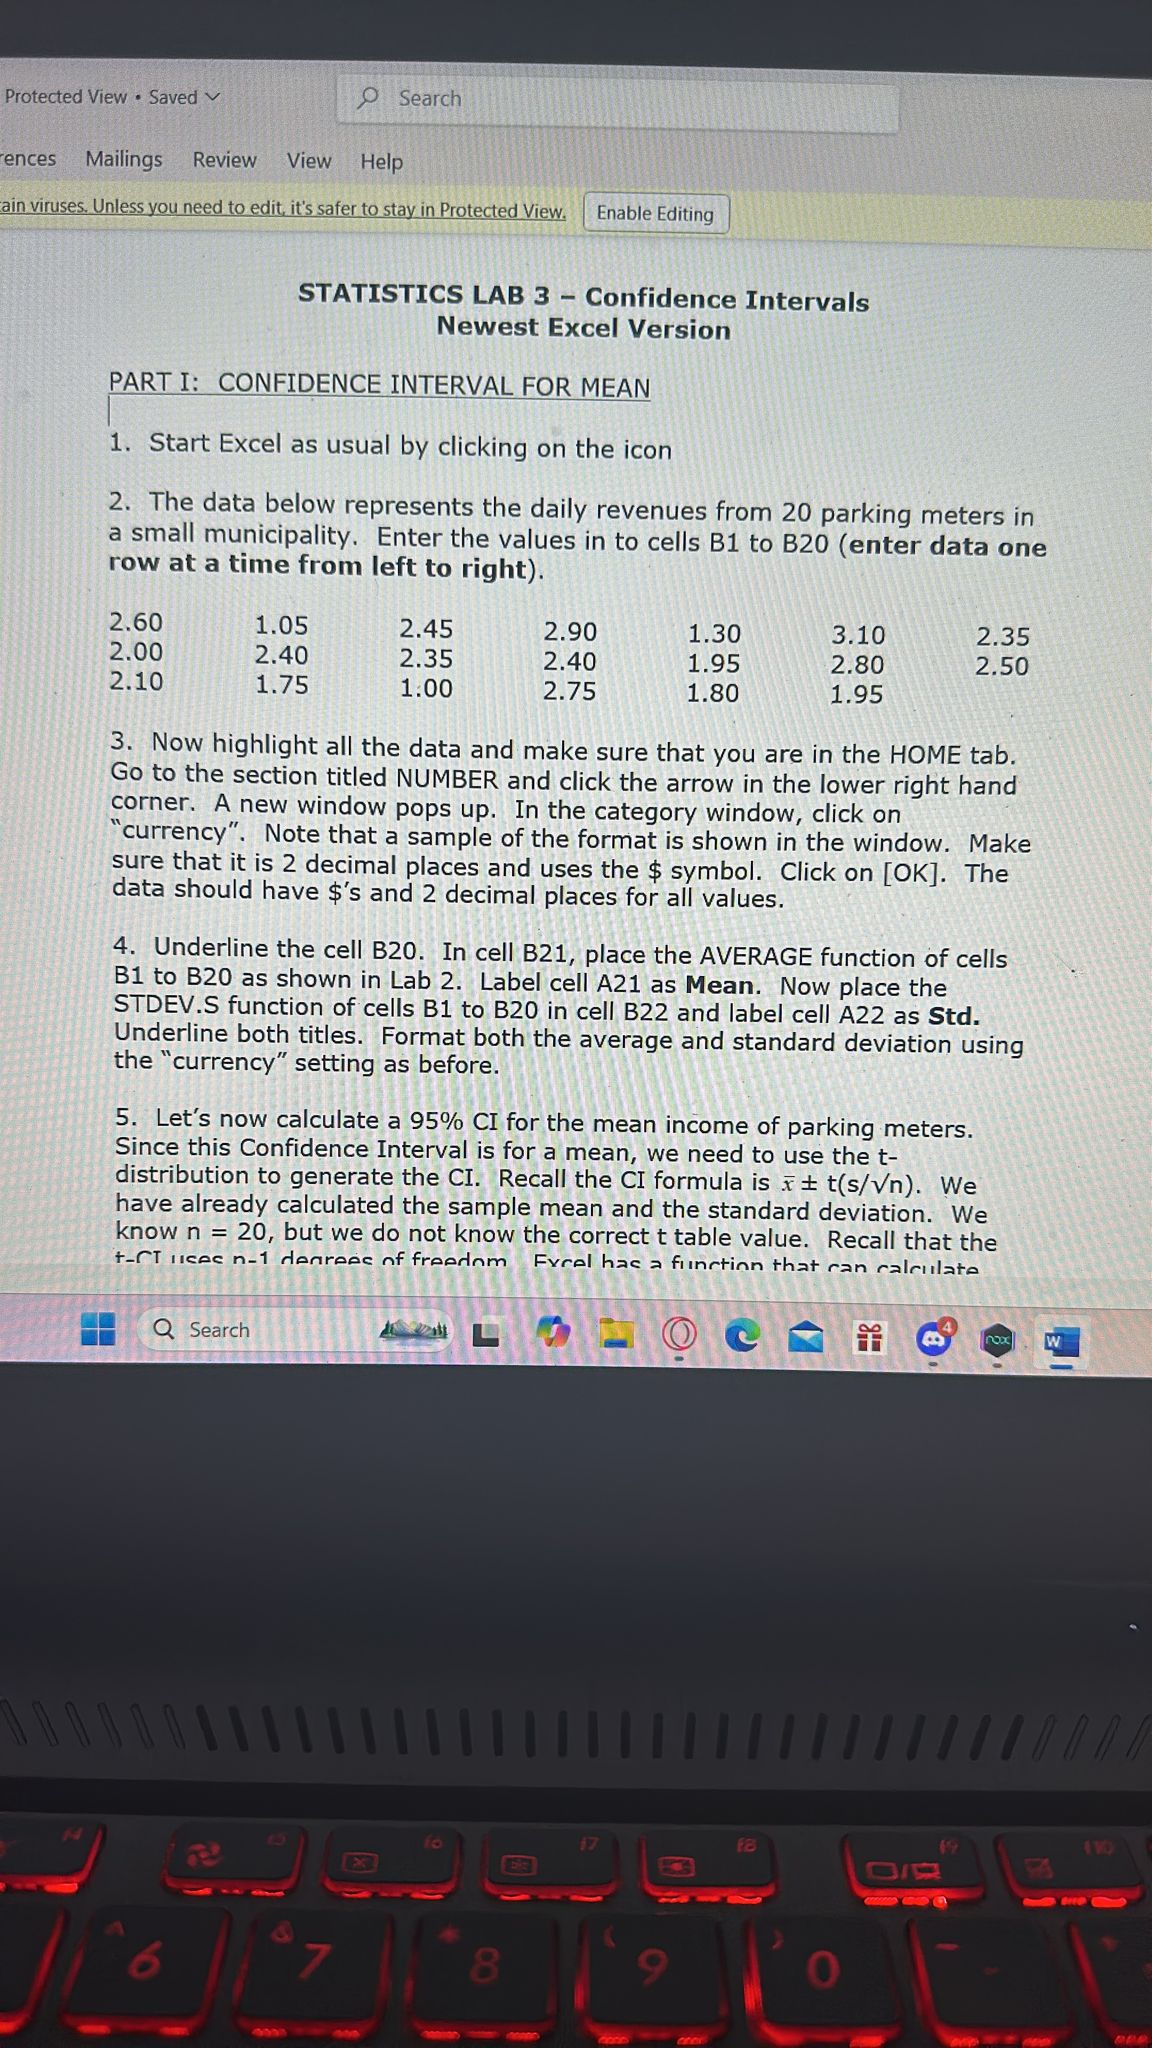
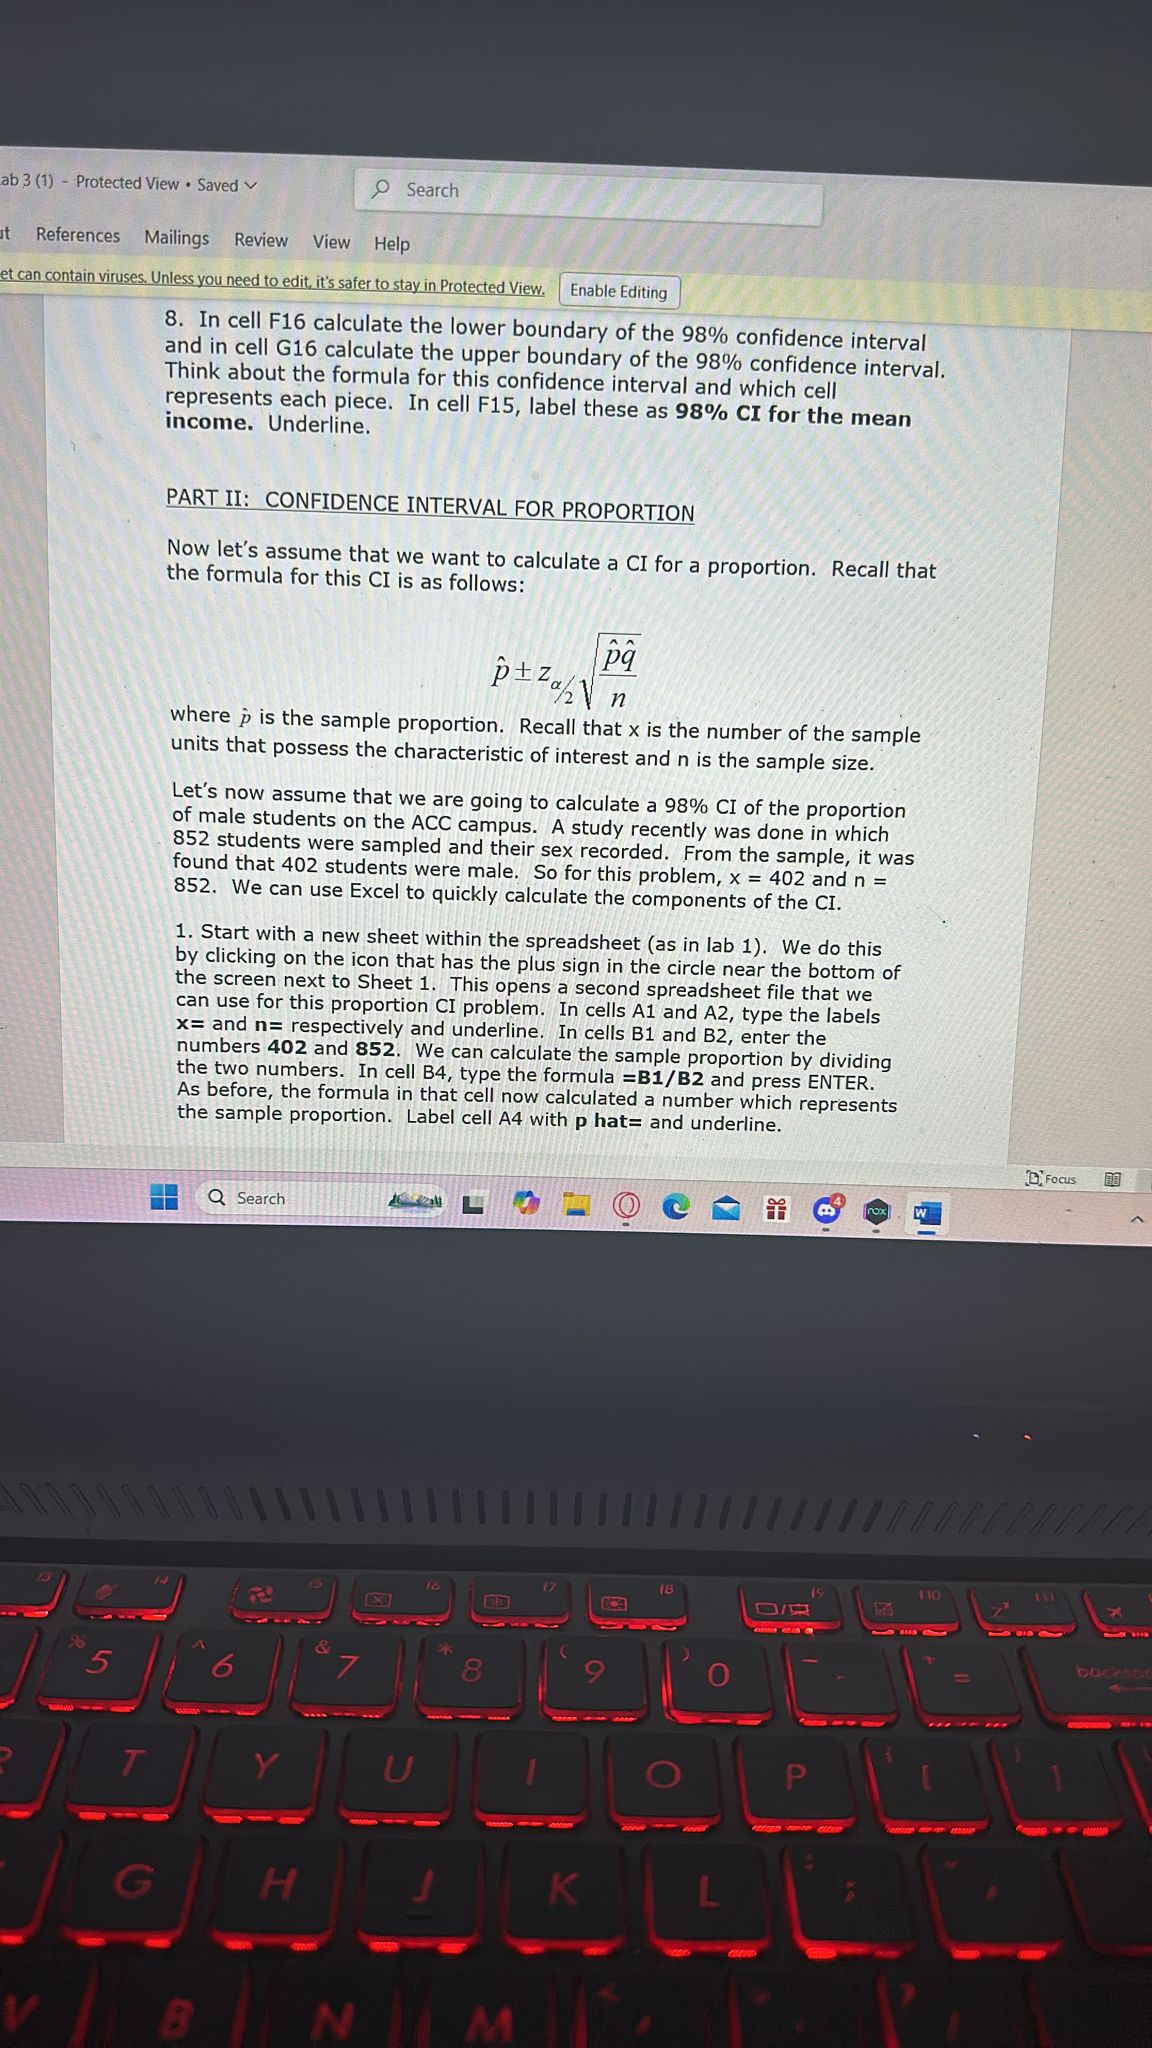
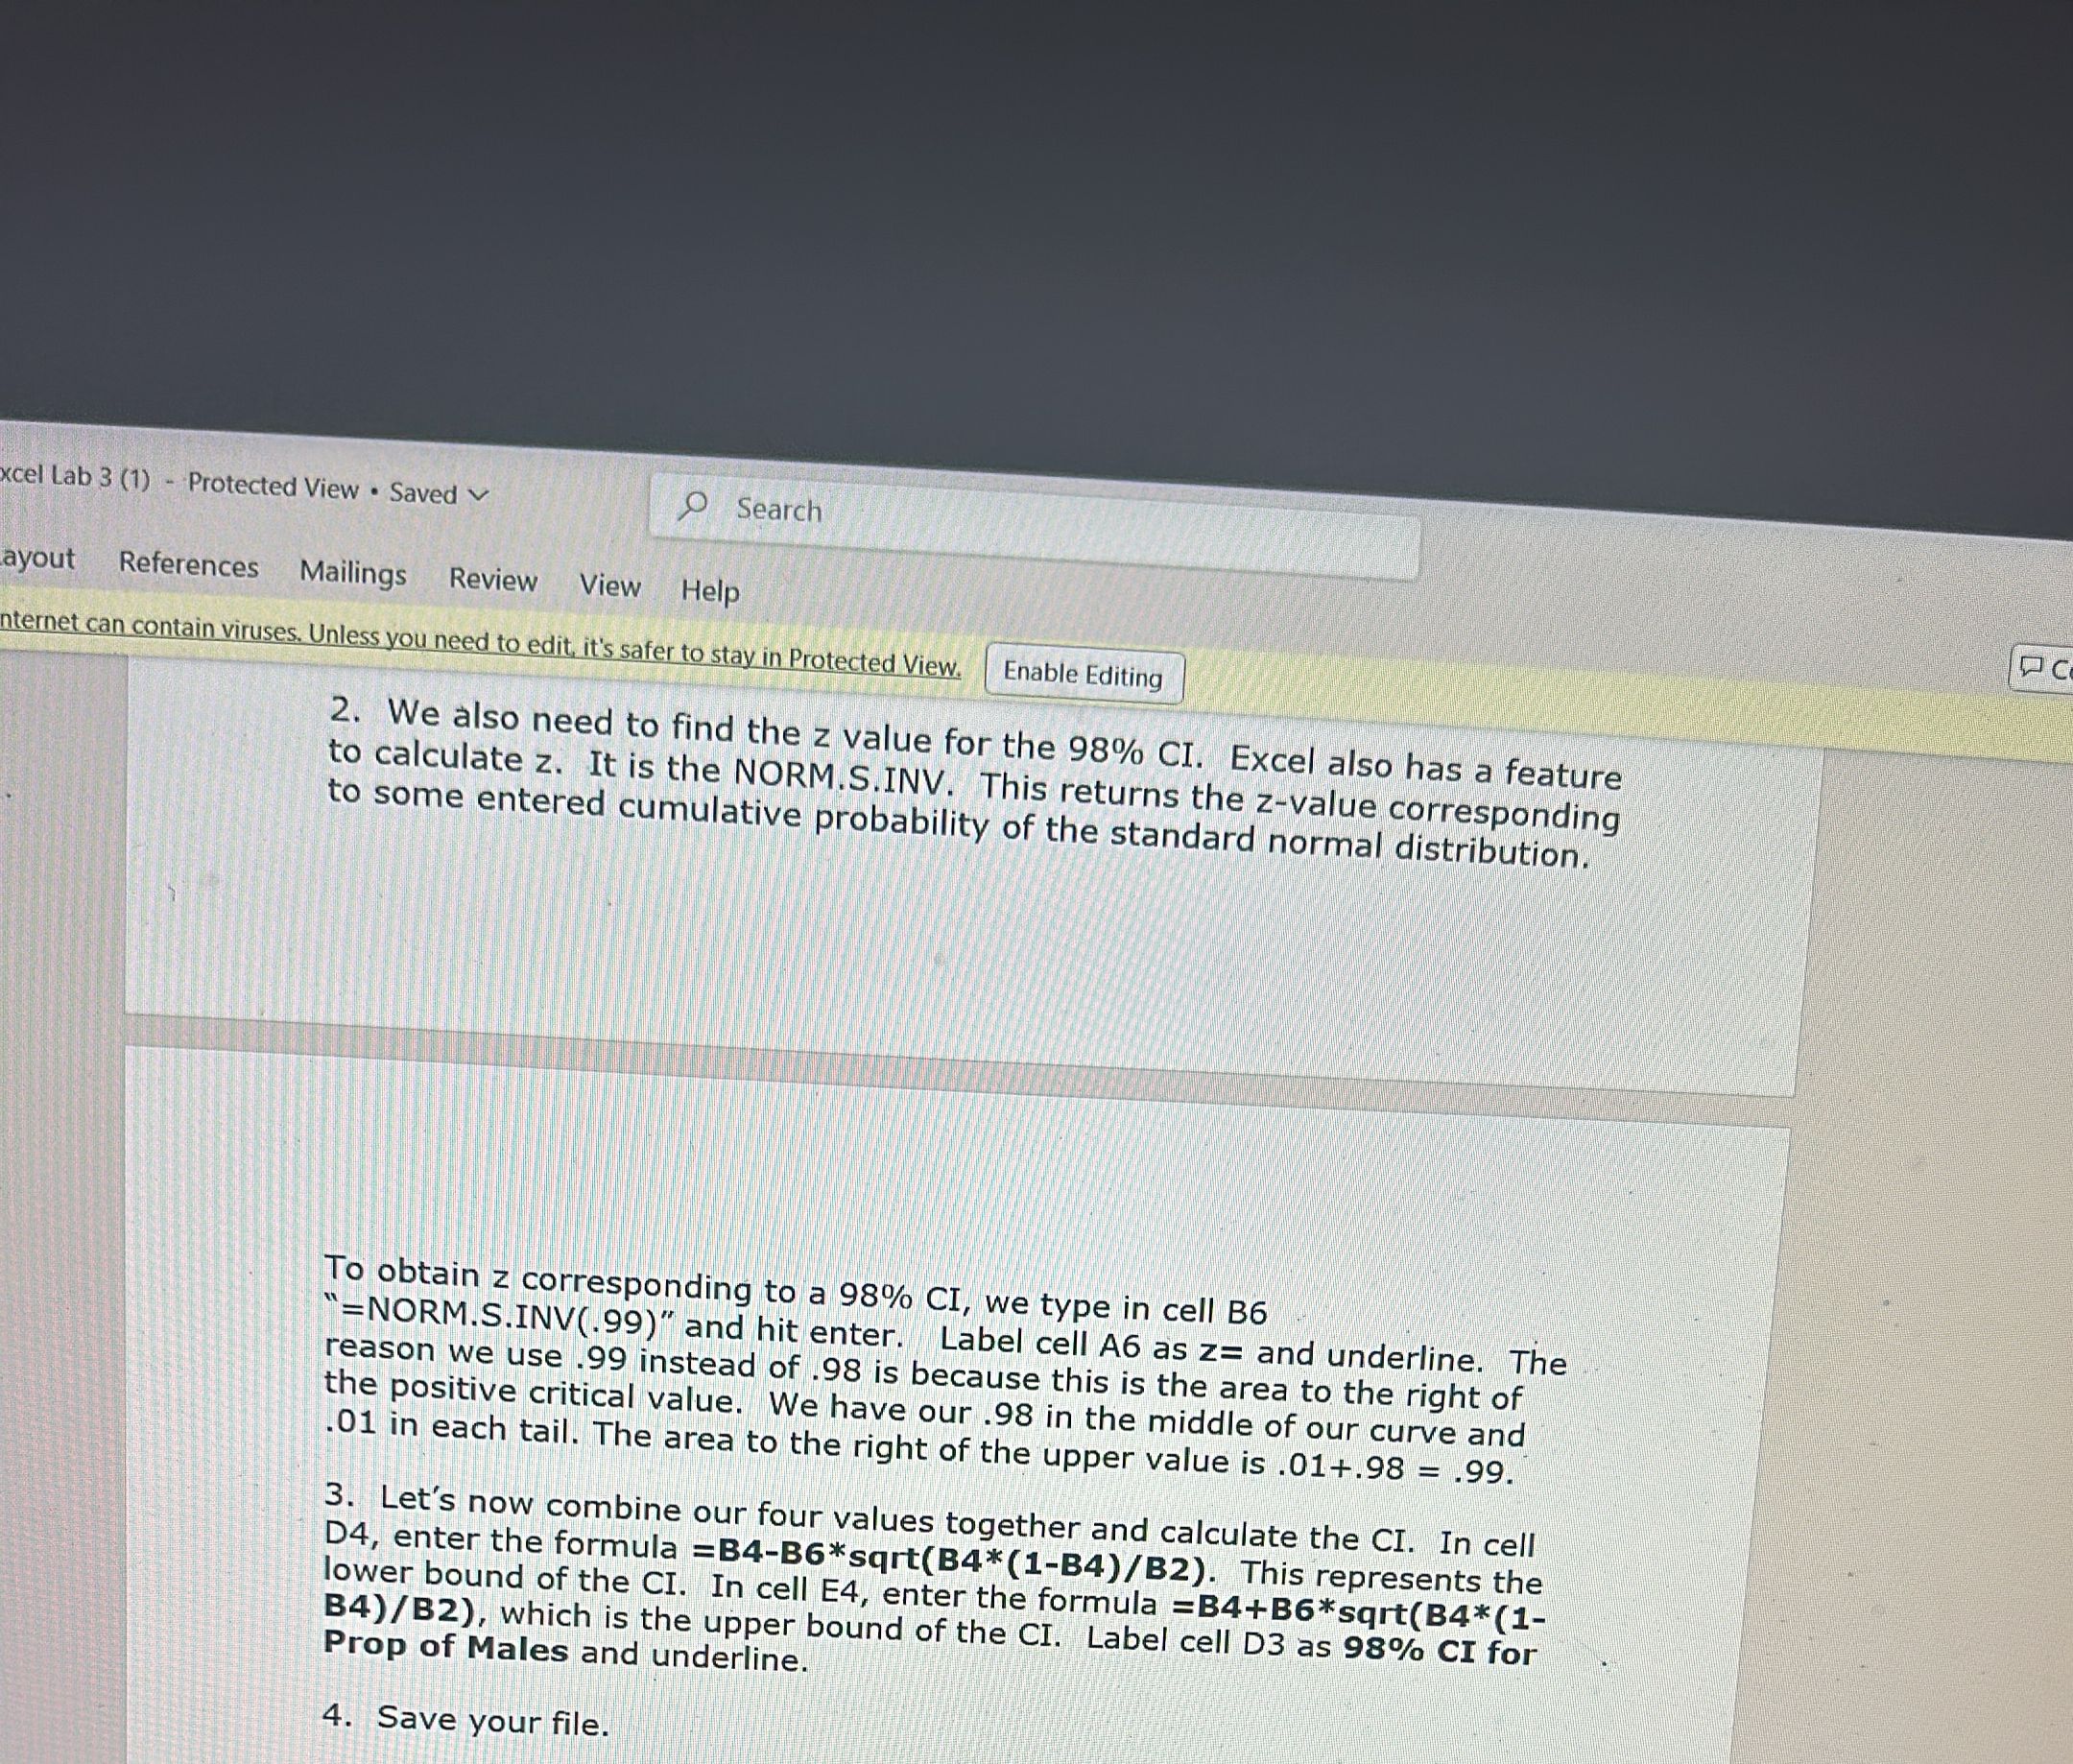
Protected View . Saved 9 Search erences Mailings Review View Help tain viruses. Unless you need to edit, it's safer to stay in Protected View. Enable Editing 5. Let's now calculate a 95% CI for the mean income of parking meters. Since this Confidence Interval is for a mean, we need to use the t- distribution to generate the CI. Recall the CI formula is * + t(s/Vn). We have already calculated the sample mean and the standard deviation. We know n = 20, but we do not know the correct t table value. Recall that the t-CI uses n-1 degrees of freedom. Excel has a function that can calculate the needed t value. Activate cell D12 and type the function `=TINV(.05,19)". Label cell D11 as 95% CI t-value and underline. Note: we are using .05 in this function because we want a 95% confidence interval and 1 - .95 = .05. 6. Now in cell F12, type the entry =B21-D12*B22/(SQRT(20)). This represents that calculation of the lower bound of the CI. In cell G12, type =B21+D12*B22/(SQRT(20)), representing the upper bound of the CI. Label cell F11 as 95% CI for the mean income and underline it. DO NOT CHANGE THE WIDTH OF ANY OF THE COLUMNS or you work will not fit on one page! 7. In cell D16 find the t value for a 98% confidence interval for this data and label cell D15 98% CI t-value. Underline. 8. In cell F16 calculate the lower boundary of the 98% confidence interval and in cell G16 calculate the unner boundary of the 98% confidence interval. W Q Search 18 14 XProtected View . Saved v 9 Search ences Mailings Review View Help ain viruses. Unless you need to edit, it's safer to stay in Protected View. Enable Editing STATISTICS LAB 3 - Confidence Intervals Newest Excel Version PART I: CONFIDENCE INTERVAL FOR MEAN 1. Start Excel as usual by clicking on the icon 2. The data below represents the daily revenues from 20 parking meters in a small municipality. Enter the values in to cells B1 to B20 (enter data one row at a time from left to right). 2.60 1.05 2.45 2.90 1.30 3.10 2.35 2.00 2.40 2.35 2.40 1.95 2.80 2.50 2.10 1.75 1.00 2.75 1.80 1.95 3. Now highlight all the data and make sure that you are in the HOME tab. Go to the section titled NUMBER and click the arrow in the lower right hand corner. A new window pops up. In the category window, click on "currency". Note that a sample of the format is shown in the window. Make sure that it is 2 decimal places and uses the $ symbol. Click on [OK]. The data should have $'s and 2 decimal places for all values. 4. Underline the cell B20. In cell B21, place the AVERAGE function of cells B1 to B20 as shown in Lab 2. Label cell A21 as Mean. Now place the STDEV.S function of cells B1 to B20 in cell B22 and label cell A22 as Std. Underline both titles. Format both the average and standard deviation using the "currency" setting as before. 5. Let's now calculate a 95% CI for the mean income of parking meters. Since this Confidence Interval is for a mean, we need to use the t- distribution to generate the CI. Recall the CI formula is * + t(s/Vn). We have already calculated the sample mean and the standard deviation. We know n = 20, but we do not know the correct t table value. Recall that the +-CT licec n-1 denrees of freedom Fvrel has a function that can calculate Q Search W 17 6 8ab3 (1) - Protected View Saved v Search Mailings Review View Help contain viruses. Unless you need to edit, it's safer to stay in Protected View, | Enable Editing | 8. In cell F16 calculate the lower boundary of the 98% confidence interval and in cell G16 calculate the upper boundary of the 989 confidence interval. Think about the formula for this confidence interval and which cell represents each piece. In cell F15, label these as 98% CI for the mean income. Underline. PART II: CONFIDENCE INTERVAL FOR PROPORTION Now let's assume that we want to calculate a CI for a proportion. Recall that the formula for this CI is as follows: o Pq p i Za_/. AL 2Y n : where p is the sample proportion. Recall that x is the number of the sample units that possess the characteristic of interest and n is the sample size. Let's now assume that we of male students on the 852 students were sa found that 402 students were mal m the sample, it was 852. We can use Excel to quickly . So for this problem, x = 402 and n = calculate the components of the CI. 1. Start with a new sheet within the spreadsheet (as in lab 1), We do this by clicking on the icon that has the plus sign in the circle near the bottom of the screen next to Sheet 1. This opens a second spreadsheet file that we can use for this proportion CI problem. In cells A1 and A2, type the labels x= and n= respectively and underline. In cells Bl and B2, enter the numbers 402 and 852. We can calculate the sample proportion by dividing the two numbers. In cell B4, type the formula =B1/B2 and press ENTER. As before, the formula in that cell now calculated a number which represents the sample proportion. Label cell A4 with p hat= and underline. EE Q Search i deh Lo @:@:@@'g cel Lab 3 (1) - Protected View . Saved Search ayout References Mailings Review View Help nternet can contain viruses. Unless you need to edit, it's safer to stay in Protected View. Enable Editing 2. We also need to find the z value for the 98% CI. Excel also has a feature to calculate z. It is the NORM.S.INV. This returns the z-value corresponding to some entered cumulative probability of the standard normal distribution. To obtain z corresponding to a 98% CI, we type in cell B6 =NORM.S.INV(.99)" and hit enter. Label cell A6 as z= and underline. The reason we use .99 instead of .98 is because this is the area to the right of the positive critical value. We have our .98 in the middle of our curve and 01 in each tail. The area to the right of the upper value is . 01+.98 = .99. 3. Let's now combine our four values together and calculate the CI. In cell D4, enter the formula =B4-B6*sqrt(B4*(1-B4)/B2). This represents the lower bound of the CI. In cell E4, enter the formula =B4+B6*sqrt(B4*(1- B4)/B2), which is the upper bound of the CI. Label cell D3 as 98% CI for Prop of Males and underline. 4. Save your file
Step by Step Solution
There are 3 Steps involved in it
1 Expert Approved Answer
Step: 1 Unlock
Question Has Been Solved by an Expert!
Get step-by-step solutions from verified subject matter experts
Step: 2 Unlock
Step: 3 Unlock
Students Have Also Explored These Related Mathematics Questions!