

Question: please provide excel formuals a. Use the historical price data from the table that follows for the Standard & Poor's 500 Index, Wal-Mart, and Target
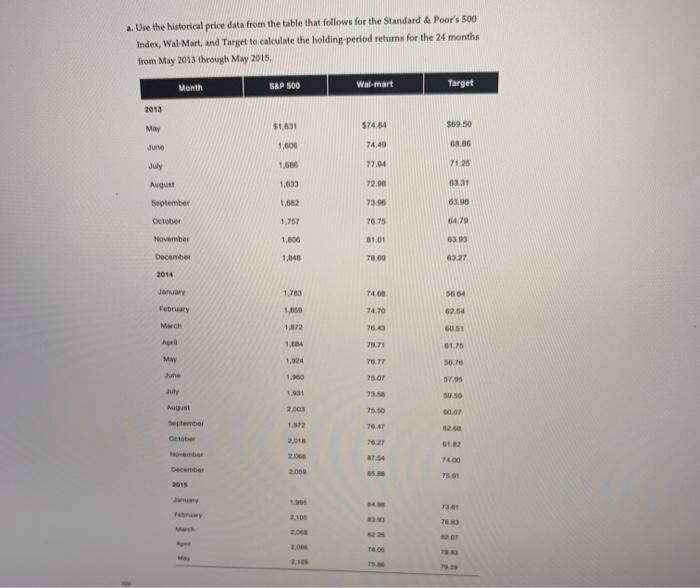
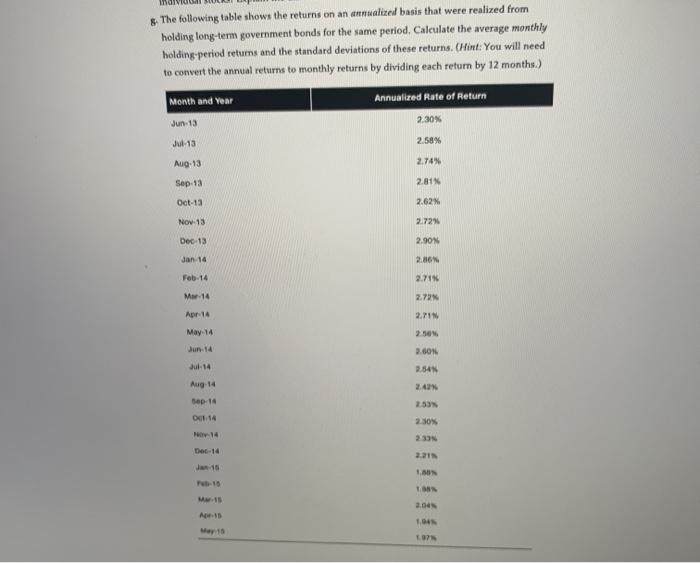
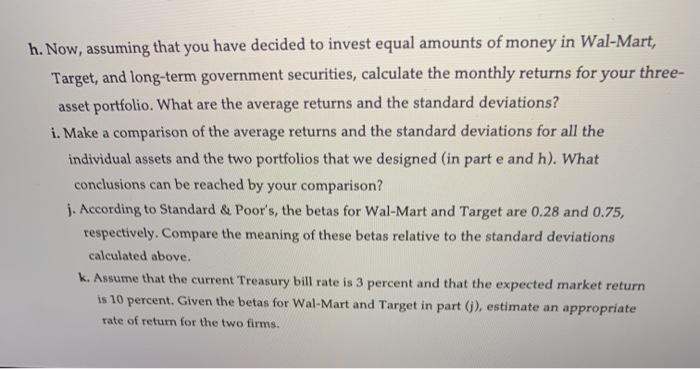
a. Use the historical price data from the table that follows for the Standard & Poor's 500 Index, Wal-Mart, and Target to calculate the holding period retums for the 24 months from May 2013 through May 2015 Month S&P 500 Walmart Target 2013 May 51.631 374.54 $69.50 June 1.000 74.40 68.86 July 1.680 77.04 7125 August 1,633 72.00 331 September 1,682 73.90 63.98 October 1.757 76.75 64.70 November 1.000 31.01 6303 December 1.140 78.60 03 27 2014 1.783 7400 564 Joy February 1.650 74.70 62.54 March 1.872 75.0 0.51 Ar 1.064 79.71 01.15 May 1,024 76.77 56.76 1.00 15.01 7.95 July 1981 30.50 2.00 15.00 60.07 172 76.47 20 tember October 2.018 1027 . 2060 ST:54 7400 2069 6. 751 T.00 2.1 b. Calculate the average monthly holding-period returns and the standard deviation of these returns for the S&P 500 Index, Wal-Mart, and Target. c. Plot (1) the holding-period returns for Wal-Mart against the Standard & Poor's 500 Index, and (2) the Target holding-period returns against the Standard & Poor's 500 Index. (Use Figure 6-5 as the format for your graph.) d. From your graphs in part (c), describe the nature of the relationship between the stock returns for Wal-Mart and the returns for the S&P 500 Index. Make the same comparison for Target e. Assume that you have decided to invest one-half of your money in Wal-Mart and the remainder in Target. Calculate the monthly holding-period returns for your two-stock portfolio. (Hint: The monthly return for the portfolio is the average of the two stocks' monthly returns.) f. Plot the returns of your two-stock portfolio against the Standard & Poor's 500 Index as you did for the individual stocks in part (c). How does this graph compare to the graphs for the individual stocks? Explain the difference. & The following table shows the returns on an analized basis that were realized from holding long-term government bonds for the same period. Calculate the average monthly holding period returns and the standard deviations of these returns. (Hint: You will need to convert the annual returns to monthly returns by dividing each return by 12 months) Month and Year Annualized Rate of Return Jun 13 2.30% JU-13 2.58% 2.74% Aug-13 Sep 13 2.81 Oct-13 2.62 Nov 15 2.72% Dec 13 2.90N Jan 14 2.86% Feb 14 2.71 Mar. 14 2.72 2.IN Apr 14 May 14 2.60 2.54 Aug 14 24 Bop: 14 2 30% 14 Dec 14 2:21 Pet 15 TON Mw.15 2.04 May 13 1,04 17 h. Now, assuming that you have decided to invest equal amounts of money in Wal-Mart, Target, and long-term government securities, calculate the monthly returns for your three- asset portfolio. What are the average returns and the standard deviations? i. Make a comparison of the average returns and the standard deviations for all the individual assets and the two portfolios that we designed (in part e and h). What conclusions can be reached by your comparison? j. According to Standard & Poor's, the betas for Wal-Mart and Target are 0.28 and 0.75, respectively. Compare the meaning of these betas relative to the standard deviations calculated above. k. Assume that the current Treasury bill rate is 3 percent and that the expected market return is 10 percent. Given the betas for Wal-Mart and Target in part (), estimate an appropriate rate of return for the two firms
Step by Step Solution
There are 3 Steps involved in it

Get step-by-step solutions from verified subject matter experts