

Question: PLEASE PROVIDE EXCEL FORMULAS OR I WILL THUMBS DOWN DO NOT COPY FROM PREVIOUS POST OR I WILL THUMBS DOWN Excel Online Structured Activity: Statistical
PLEASE PROVIDE EXCEL FORMULAS OR I WILL THUMBS DOWN
DO NOT COPY FROM PREVIOUS POST OR I WILL THUMBS DOWN
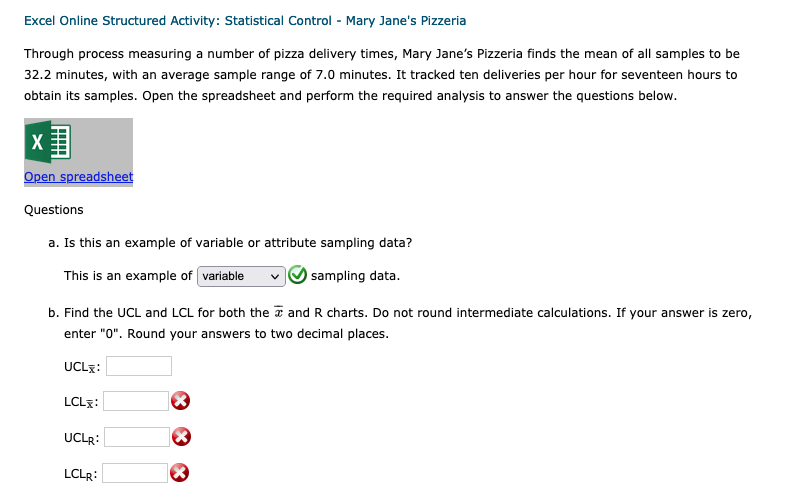
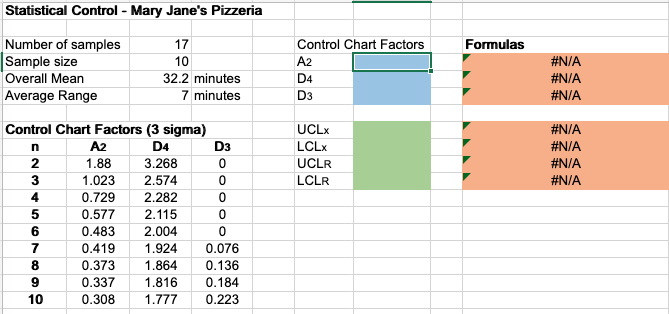
Excel Online Structured Activity: Statistical Control - Mary Jane's Pizzeria Through process measuring a number of pizza delivery times, Mary Jane's Pizzeria finds the mean of all samples to be 32.2 minutes, with an average sample range of 7.0 minutes. It tracked ten deliveries per hour for seventeen hours to obtain its samples. Open the spreadsheet and perform the required analysis to answer the questions below. Open spreadsheet Questions a. Is this an example of variable or attribute sampling data? This is an example of variable sampling data. b. Find the UCL and LCL for both the T and R charts. Do not round intermediate calculations. If your answer is zero, enter "0". Round your answers to two decimal places. UCLX LCL: UCLR: LCLR: Statistical Control - Mary Jane's Pizzeria Formulas Control Chart Factors A2 D4 D3 #N/A #N/A #N/A n Number of samples 17 Sample size 10 Overall Mean 32.2 minutes Average Range 7 minutes Control Chart Factors (3 sigma) A2 D4 D3 2 1.88 3.268 0 3 1.023 2.574 0 4 0.729 2.282 0 5 0.577 2.115 0 0.483 2.00 7 0.419 1.924 0.076 8 0.373 1.864 0.136 9 0.337 1.816 0.184 10 0.308 1.777 0.223 UCLX LCLX UCLR LCLR #N/A #N/A #N/A #N/AStep by Step Solution
There are 3 Steps involved in it
1 Expert Approved Answer
Step: 1 Unlock

Question Has Been Solved by an Expert!
Get step-by-step solutions from verified subject matter experts
Step: 2 Unlock
Step: 3 Unlock