

Question: Please answer this question and not just post an old one! Thank you!! Excel Online Structured Activity: Statistical Control Mary Jane's Pizzeria Through process measuring
Please answer this question and not just post an old one! Thank you!! 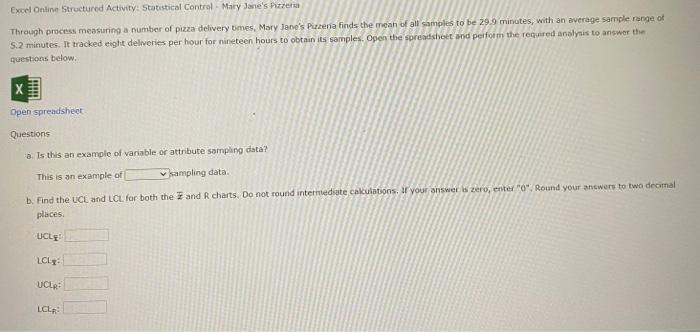
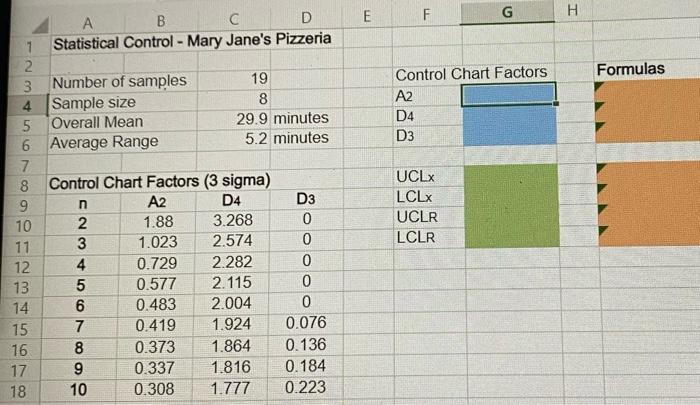
Excel Online Structured Activity: Statistical Control Mary Jane's Pizzeria Through process measuring a number of pizza delivery times, Mary Jane's Puzzena finds the mean of all samples to be 29.9 minutes, with an average sample range of 5.2 minutes. It tracked eight deliveries per hour for nineteen hours to obtain its samples. Open the spreadsheet and perform the required analysis to answer the Questions below. X H. Open spreadsheet Questions a. Is this an example of variable or attribute sampling data? This is an example of sampling data b. Find the UCL and LCL for both the and R charts. Do not round intermediate calculations. Il your answer zero, enter"0" Round your answers to two decimal places. UCLE LCLE: UCLR LCLR E F G H Formulas Control Chart Factors A2 D4 D3 B D 1 Statistical Control - Mary Jane's Pizzeria 2. 3 Number of samples 19 4 Sample size 8 5 Overall Mean 29.9 minutes 6 Average Range 5.2 minutes 7 8 Control Chart Factors (3 sigma) 9 n A2 D4 D3 10 2 1.88 3.268 0 3 11 1.023 2.574 0 12 4 0.729 2.282 0 13 5 0.577 2.115 0 14 6 0.483 2.004 0 15 7 0.419 1.924 0.076 16 8 0.373 1.864 0.136 17 9 0.337 1.816 0.184 18 10 0.308 1.777 0.223 UCLX LCLX UCLR LCLR WN COK Step by Step Solution
There are 3 Steps involved in it
1 Expert Approved Answer
Step: 1 Unlock

Question Has Been Solved by an Expert!
Get step-by-step solutions from verified subject matter experts
Step: 2 Unlock
Step: 3 Unlock