Question: Please provide excel sheet as well please and i'll give you a good rating 5 of 5 (4 complete) HW Score: 0%, 0 of 5
 Please provide excel sheet as well please and i'll give you a good rating
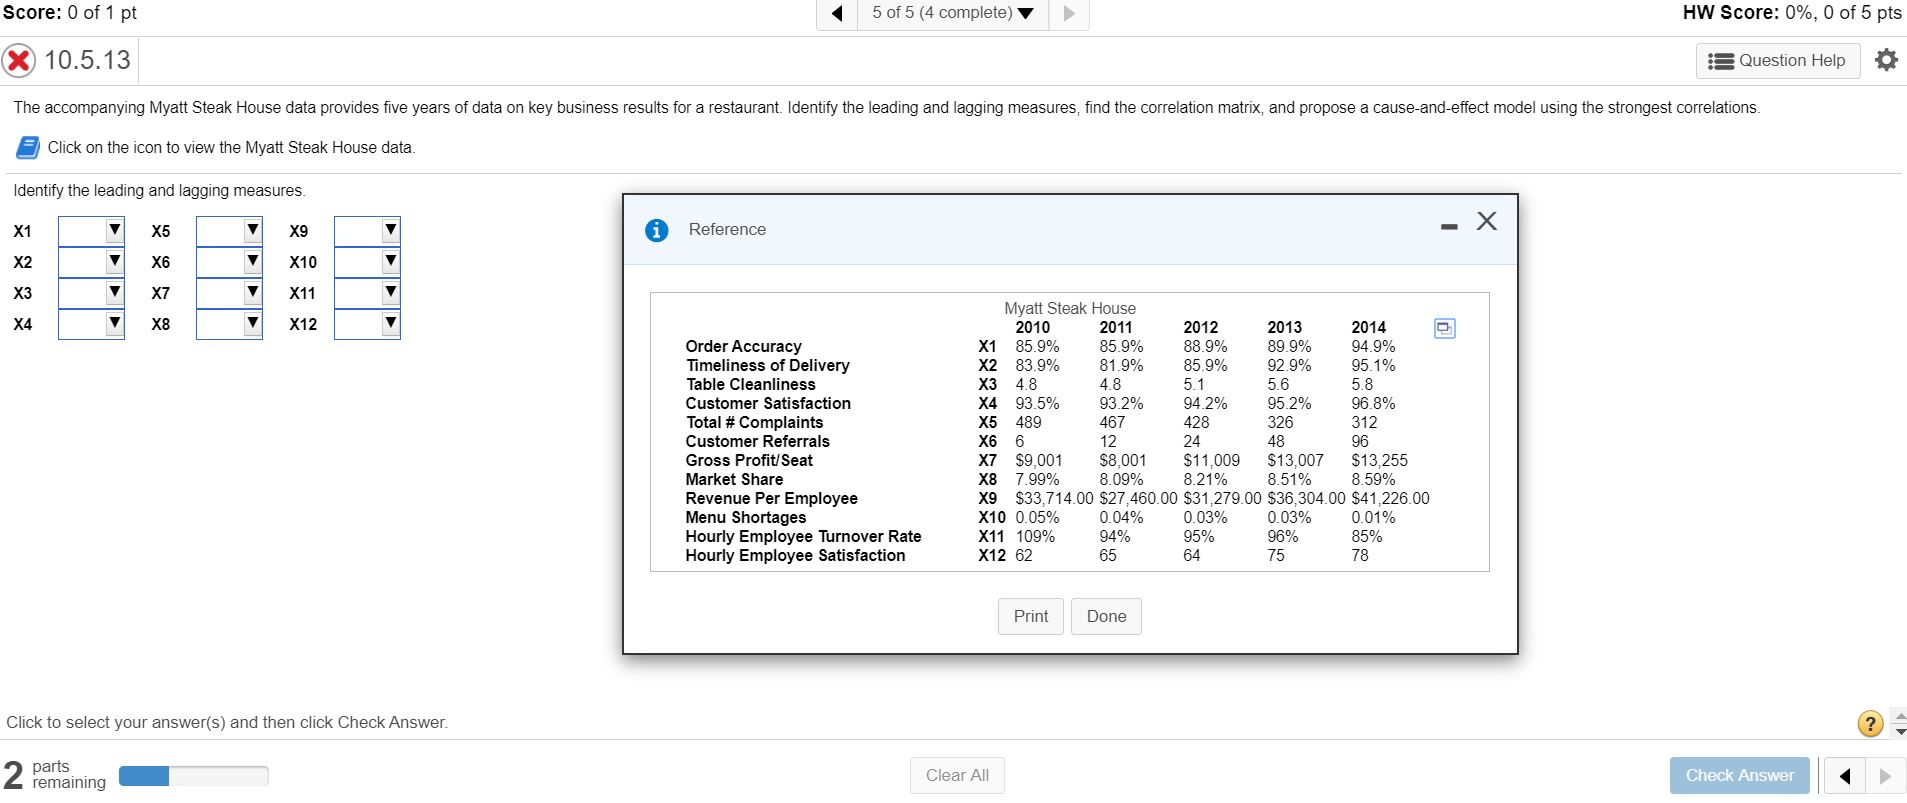
5 of 5 (4 complete) HW Score: 0%, 0 of 5 pts Score: 0 of 1 pt X 10.5.13 Question Help The accompanying Myatt Steak House data provides five years of data on key business results for a restaurant. Identify the leading and lagging measures, find the correlation matrix, and propose a cause-and-effect model using the strongest correlations Click on the icon to view the Myatt Steak House data. Identify the leading and lagging measures. Reference 312 Myatt Steak House 2010 2011 2012 2013 2014 X1 85.9% 85.9% 88.9% 89.9% 94.9% X2 83.9% 81.9% 85.9% 92.9% 95.1% X3 4.8 4.8 5.1 5.6 5.8 X4 93.5% 93.2% 94.2% 95.2% 96.8% X5 489 467 428 326 X6 6 48 96 X7 $9,001 $8,001 $11,009 $13,007 $13,255 X8 7.99% 8.09% 8.21% 8.51% 8.59% X9 $33.714.00 $27.460.00 $31.279.00 $36.304.00 $41.226.00 X10 0.05% 0.04% 0.03% 0.03% 0.01% X11 109% 94% 95% 96% 85% X12 62 65 64 75 78 12 Order Accuracy Timeliness of Delivery Table Cleanliness Customer Satisfaction Total # Complaints Customer Referrals Gross Profit/Seat Market Share Revenue Per Employee Menu Shortages Hourly Employee Turnover Rate Hourly Employee Satisfaction 24 Print Done Click to select your answer(s) and then click Check Answer parts 2 remaining Clear All Check Answer 5 of 5 (4 complete) HW Score: 0%, 0 of 5 pts Score: 0 of 1 pt X 10.5.13 Question Help The accompanying Myatt Steak House data provides five years of data on key business results for a restaurant. Identify the leading and lagging measures, find the correlation matrix, and propose a cause-and-effect model using the strongest correlations Click on the icon to view the Myatt Steak House data. Identify the leading and lagging measures. Reference 312 Myatt Steak House 2010 2011 2012 2013 2014 X1 85.9% 85.9% 88.9% 89.9% 94.9% X2 83.9% 81.9% 85.9% 92.9% 95.1% X3 4.8 4.8 5.1 5.6 5.8 X4 93.5% 93.2% 94.2% 95.2% 96.8% X5 489 467 428 326 X6 6 48 96 X7 $9,001 $8,001 $11,009 $13,007 $13,255 X8 7.99% 8.09% 8.21% 8.51% 8.59% X9 $33.714.00 $27.460.00 $31.279.00 $36.304.00 $41.226.00 X10 0.05% 0.04% 0.03% 0.03% 0.01% X11 109% 94% 95% 96% 85% X12 62 65 64 75 78 12 Order Accuracy Timeliness of Delivery Table Cleanliness Customer Satisfaction Total # Complaints Customer Referrals Gross Profit/Seat Market Share Revenue Per Employee Menu Shortages Hourly Employee Turnover Rate Hourly Employee Satisfaction 24 Print Done Click to select your answer(s) and then click Check Answer parts 2 remaining Clear All Check Answer


