

Question: please provide explanation and step by step to the question Measures of entral Tendency for Ungrouped Data 1. The following table gives the frequency distribution
please provide explanation and step by step to the question
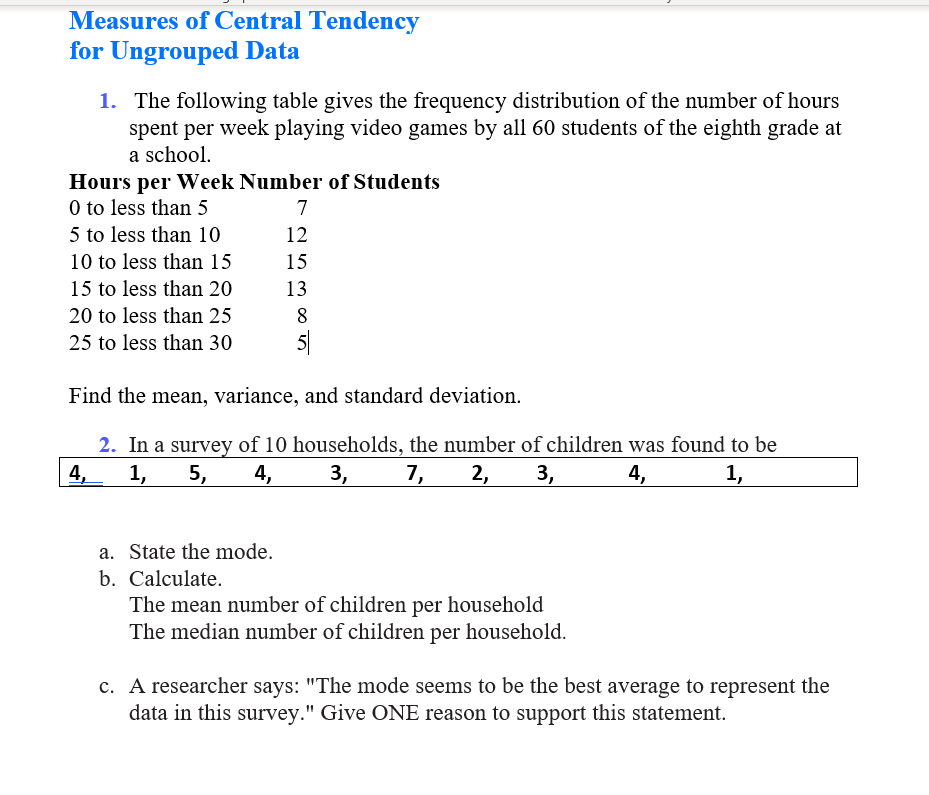
Measures of entral Tendency for Ungrouped Data 1. The following table gives the frequency distribution of the number of hours spent per week playing video games by all 60 students of the eighth grade at a school. Hours per Week Number of Students 0 to less than 5 7 5 to less than 10 12 10 to less than 15 15 15 to less than 20 13 20 to less than 25 8 25 to less than 30 5' Find the mean, variance, and standard deviation. 2- In a survey of 10 households, the number of children was found to be L 1. 5. 4. 3. 7. 2. 3. 4. 1. a. State the mode. b. Calculate. The mean number of children per household The median number of children per household. {3. A researcher says: "The mode seems to be the best average to represent the data in this survey.\" Give ONE reason to support this statement
Step by Step Solution
There are 3 Steps involved in it

Get step-by-step solutions from verified subject matter experts