

Question: please provide graph and step by step Problem 5 The manager of a department store wants to evaluate the relationship between the sales of air
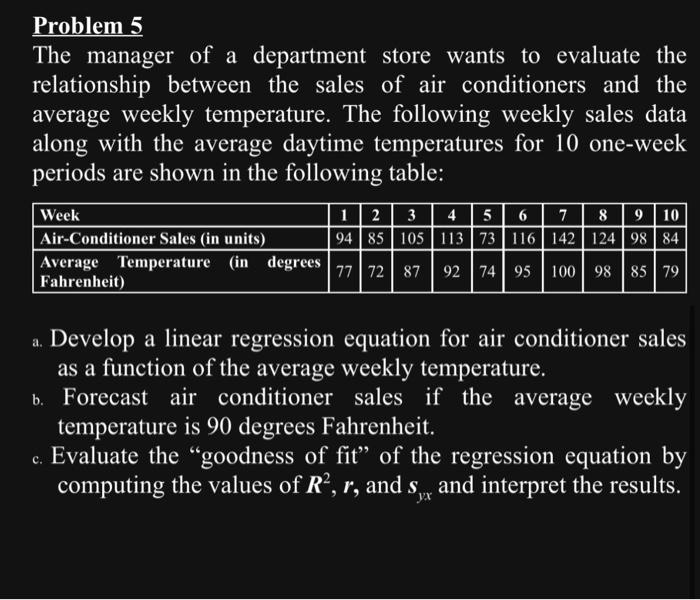
Problem 5 The manager of a department store wants to evaluate the relationship between the sales of air conditioners and the average weekly temperature. The following weekly sales data along with the average daytime temperatures for 10 one-week periods are shown in the following table: a. Develop a linear regression equation for air conditioner sales as a function of the average weekly temperature. b. Forecast air conditioner sales if the average weekly temperature is 90 degrees Fahrenheit. c. Evaluate the "goodness of fit" of the regression equation by computing the values of R2,r, and syx and interpret the results. Problem 5 The manager of a department store wants to evaluate the relationship between the sales of air conditioners and the average weekly temperature. The following weekly sales data along with the average daytime temperatures for 10 one-week periods are shown in the following table: a. Develop a linear regression equation for air conditioner sales as a function of the average weekly temperature. b. Forecast air conditioner sales if the average weekly temperature is 90 degrees Fahrenheit. c. Evaluate the "goodness of fit" of the regression equation by computing the values of R2,r, and syx and interpret the results
Step by Step Solution
There are 3 Steps involved in it

Get step-by-step solutions from verified subject matter experts