

Question: PLEASE PROVIDE JUST ANSWERS , NO EXPLANATION NEEDED. IT WOULD BE PREFERABLE IF YOU USE R LANGUAGE Download daily stock prices for Apple and Target
PLEASE PROVIDE JUST ANSWERS , NO EXPLANATION NEEDED. IT WOULD BE PREFERABLE IF YOU USE R LANGUAGE
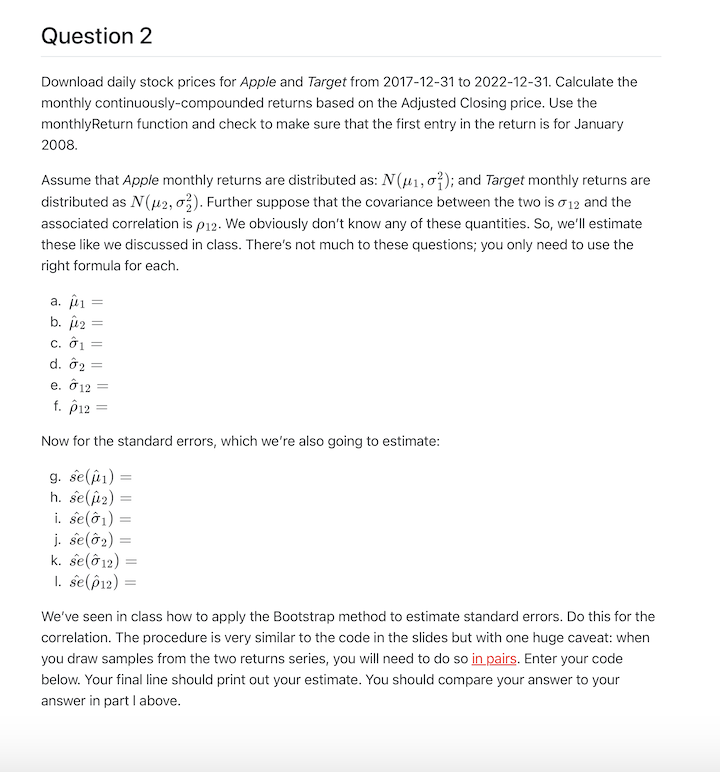
Download daily stock prices for Apple and Target from 2017-12-31 to 2022-12-31. Calculate the monthly continuously-compounded returns based on the Adjusted Closing price. Use the monthlyReturn function and check to make sure that the first entry in the return is for January 2008. Assume that Apple monthly returns are distributed as: N(1,12); and Target monthly returns are distributed as N(2,22). Further suppose that the covariance between the two is 12 and the associated correlation is 12. We obviously don't know any of these quantities. So, we'll estimate these like we discussed in class. There's not much to these questions; you only need to use the right formula for each. a. ^1= b. ^2= c. ^1= d. ^2= e. ^12= f. ^12= Now for the standard errors, which we're also going to estimate: g. se^(^1)= h. se^(^2)= i. se^(^1)= j. se^(^2)= k. se^(^12)= l. se^(^12)= We've seen in class how to apply the Bootstrap method to estimate standard errors. Do this for the correlation. The procedure is very similar to the code in the slides but with one huge caveat: when you draw samples from the two returns series, you will need to do so in pairs. Enter your code below. Your final line should print out your estimate. You should compare your answer to your answer in part I above. Download daily stock prices for Apple and Target from 2017-12-31 to 2022-12-31. Calculate the monthly continuously-compounded returns based on the Adjusted Closing price. Use the monthlyReturn function and check to make sure that the first entry in the return is for January 2008. Assume that Apple monthly returns are distributed as: N(1,12); and Target monthly returns are distributed as N(2,22). Further suppose that the covariance between the two is 12 and the associated correlation is 12. We obviously don't know any of these quantities. So, we'll estimate these like we discussed in class. There's not much to these questions; you only need to use the right formula for each. a. ^1= b. ^2= c. ^1= d. ^2= e. ^12= f. ^12= Now for the standard errors, which we're also going to estimate: g. se^(^1)= h. se^(^2)= i. se^(^1)= j. se^(^2)= k. se^(^12)= l. se^(^12)= We've seen in class how to apply the Bootstrap method to estimate standard errors. Do this for the correlation. The procedure is very similar to the code in the slides but with one huge caveat: when you draw samples from the two returns series, you will need to do so in pairs. Enter your code below. Your final line should print out your estimate. You should compare your answer to your answer in part I above
Step by Step Solution
There are 3 Steps involved in it

Get step-by-step solutions from verified subject matter experts