

Question: Please provide MATLAB code and output plots. Exercise 3 The goal of this exercise is to create random variables from popular probability distributions, and illustrate
Please provide MATLAB code and output plots.
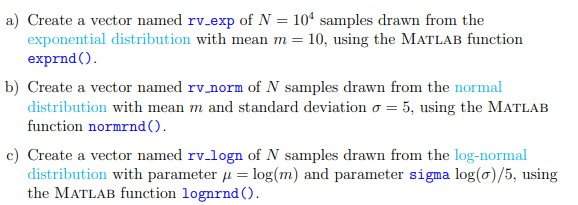
Exercise 3 The goal of this exercise is to create random variables from popular probability distributions, and illustrate that despite having the same mean, their distribution (and their extreme values) can differ significantly. You are encouraged to explore by yourself the probability distrbutions presented here (Wikipedia links provided), as well as reading the MATLAB documentation for the function used (exprnd(), etc.). a) Create a vector named rv.exp of N = 100 samples drawn from the exponential distribution with mean m = 10, using the MATLAB function exprnd(). b) Create a vector named rv norm of N samples drawn from the normal distribution with mean m and standard deviation o = 5, using the MATLAB function normrnd(). c) Create a vector named rv logn of N samples drawn from the log-normal distribution with parameter j = log(m) and parameter sigma log(0)/5, using the MATLAB function lognrnd()
Step by Step Solution
There are 3 Steps involved in it

Get step-by-step solutions from verified subject matter experts