

Question: Please provide solution through excel with formulas please. Thank You! 3. (25 points) In order to be ready for the upcoming holiday season, BTS Toy
Please provide solution through excel with formulas please.
Thank You!
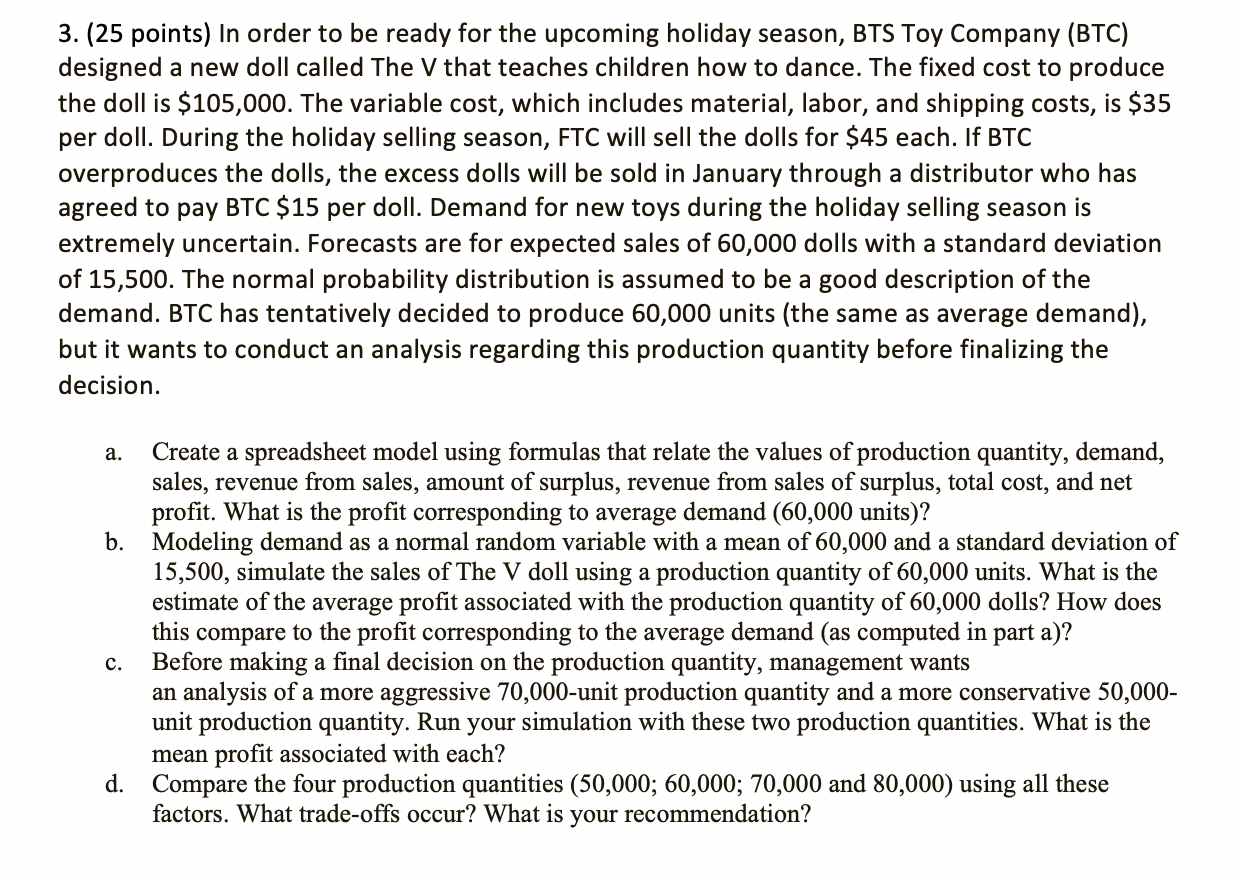
3. (25 points) In order to be ready for the upcoming holiday season, BTS Toy Company (BTC) designed a new doll called The V that teaches children how to dance. The fixed cost to produce the doll is $105,000. The variable cost, which includes material, labor, and shipping costs, is $35 per doll. During the holiday selling season, FTC will sell the dolls for $45 each. If BTC overproduces the dolls, the excess dolls will be sold in January through a distributor who has agreed to pay BTC $15 per doll. Demand for new toys during the holiday selling season is extremely uncertain. Forecasts are for expected sales of 60,000 dolls with a standard deviation of 15,500. The normal probability distribution is assumed to be a good description of the demand. BTC has tentatively decided to produce 60,000 units (the same as average demand), but it wants to conduct an analysis regarding this production quantity before finalizing the decision. a. Create a spreadsheet model using formulas that relate the values of production quantity, demand, sales, revenue from sales, amount of surplus, revenue from sales of surplus, total cost, and net profit. What is the profit corresponding to average demand (60,000 units)? b. Modeling demand as a normal random variable with a mean of 60,000 and a standard deviation of 15,500, simulate the sales of The V doll using a production quantity of 60,000 units. What is the estimate of the average profit associated with the production quantity of 60,000 dolls? How does this compare to the profit corresponding to the average demand (as computed in part a)? c. Before making a final decision on the production quantity, management wants an analysis of a more aggressive 70,000-unit production quantity and a more conservative 50,000- unit production quantity. Run your simulation with these two production quantities. What is the mean profit associated with each? d. Compare the four production quantities (50,000; 60,000; 70,000 and 80,000) using all these factors. What trade-offs occur? What is your recommendationStep by Step Solution
There are 3 Steps involved in it
1 Expert Approved Answer
Step: 1 Unlock

Question Has Been Solved by an Expert!
Get step-by-step solutions from verified subject matter experts
Step: 2 Unlock
Step: 3 Unlock