

Question: Please provide step by step excel process. Thankyou. Here is data and some facts collected by an analyst after a visit to Pitt Pens factory.
 Please provide step by step excel process. Thankyou.
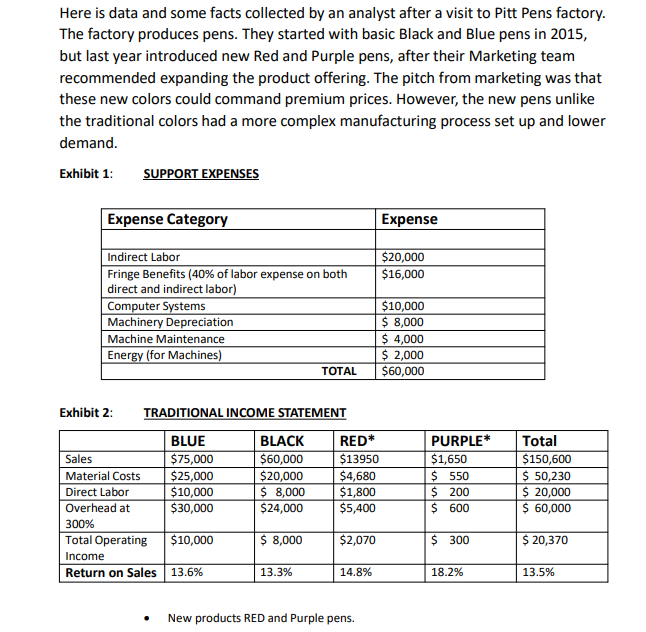
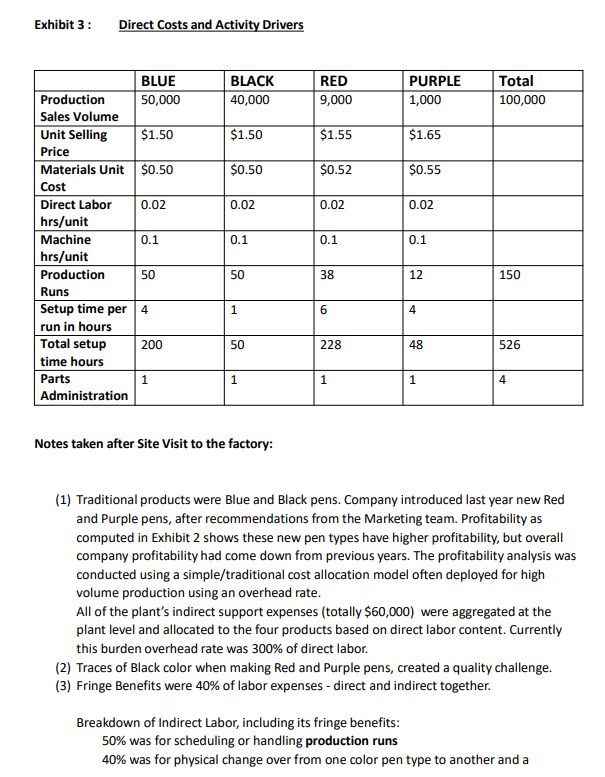
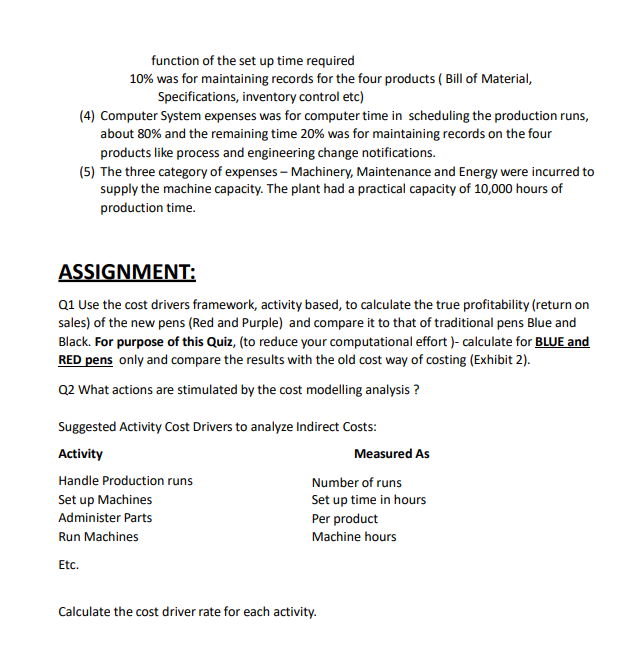
Here is data and some facts collected by an analyst after a visit to Pitt Pens factory. The factory produces pens. They started with basic Black and Blue pens in 2015, but last year introduced new Red and Purple pens, after their Marketing team recommended expanding the product offering. The pitch from marketing was that these new colors could command premium prices. However, the new pens unlike the traditional colors had a more complex manufacturing process set up and lower demand. Exhibit 1: SUPPORT EXPENSES Exhibit 2: TRADITIONAL INCOME STATEMENT - New products RED and Purple pens. Exhibit 3: Direct Costs and Activity Drivers Notes taken after Site Visit to the factory: (1) Traditional products were Blue and Black pens. Company introduced last year new Red and Purple pens, after recommendations from the Marketing team. Profitability as computed in Exhibit 2 shows these new pen types have higher profitability, but overall company profitability had come down from previous years. The profitability analysis was conducted using a simple/traditional cost allocation model often deployed for high volume production using an overhead rate. All of the plant's indirect support expenses (totally $60,000 ) were aggregated the plant level and allocated to the four products based on direct labor content. Currently this burden overhead rate was 300% of direct labor. (2) Traces of Black color when making Red and Purple pens, created a quality challenge. (3) Fringe Benefits were 40% of labor expenses - direct and indirect together. Breakdown of Indirect Labor, including its fringe benefits: 50% was for scheduling or handling production runs 40% was for physical change over from one color pen type to another and a function of the set up time required 10% was for maintaining records for the four products ( Bill of Material, Specifications, inventory control etc) (4) Computer System expenses was for computer time in scheduling the production runs, about 80% and the remaining time 20% was for maintaining records on the four products like process and engineering change notifications. (5) The three category of expenses - Machinery, Maintenance and Energy were incurred to supply the machine capacity. The plant had a practical capacity of 10,000 hours of production time. ASSIGNMENT: Q1 Use the cost drivers framework, activity based, to calculate the true profitability (return on sales) of the new pens (Red and Purple) and compare it to that of traditional pens Blue and Black. For purpose of this Quiz, (to reduce your computational effort )- calculate for BLUE and RED pens only and compare the results with the old cost way of costing (Exhibit 2). Q2 What actions are stimulated by the cost modelling analysis ? Suggested Activity Cost Drivers to analyze Indirect Costs: Calculate the cost driver rate for each activity. Here is data and some facts collected by an analyst after a visit to Pitt Pens factory. The factory produces pens. They started with basic Black and Blue pens in 2015, but last year introduced new Red and Purple pens, after their Marketing team recommended expanding the product offering. The pitch from marketing was that these new colors could command premium prices. However, the new pens unlike the traditional colors had a more complex manufacturing process set up and lower demand. Exhibit 1: SUPPORT EXPENSES Exhibit 2: TRADITIONAL INCOME STATEMENT - New products RED and Purple pens. Exhibit 3: Direct Costs and Activity Drivers Notes taken after Site Visit to the factory: (1) Traditional products were Blue and Black pens. Company introduced last year new Red and Purple pens, after recommendations from the Marketing team. Profitability as computed in Exhibit 2 shows these new pen types have higher profitability, but overall company profitability had come down from previous years. The profitability analysis was conducted using a simple/traditional cost allocation model often deployed for high volume production using an overhead rate. All of the plant's indirect support expenses (totally $60,000 ) were aggregated the plant level and allocated to the four products based on direct labor content. Currently this burden overhead rate was 300% of direct labor. (2) Traces of Black color when making Red and Purple pens, created a quality challenge. (3) Fringe Benefits were 40% of labor expenses - direct and indirect together. Breakdown of Indirect Labor, including its fringe benefits: 50% was for scheduling or handling production runs 40% was for physical change over from one color pen type to another and a function of the set up time required 10% was for maintaining records for the four products ( Bill of Material, Specifications, inventory control etc) (4) Computer System expenses was for computer time in scheduling the production runs, about 80% and the remaining time 20% was for maintaining records on the four products like process and engineering change notifications. (5) The three category of expenses - Machinery, Maintenance and Energy were incurred to supply the machine capacity. The plant had a practical capacity of 10,000 hours of production time. ASSIGNMENT: Q1 Use the cost drivers framework, activity based, to calculate the true profitability (return on sales) of the new pens (Red and Purple) and compare it to that of traditional pens Blue and Black. For purpose of this Quiz, (to reduce your computational effort )- calculate for BLUE and RED pens only and compare the results with the old cost way of costing (Exhibit 2). Q2 What actions are stimulated by the cost modelling analysis ? Suggested Activity Cost Drivers to analyze Indirect Costs: Calculate the cost driver rate for each activity
Step by Step Solution
There are 3 Steps involved in it

Get step-by-step solutions from verified subject matter experts