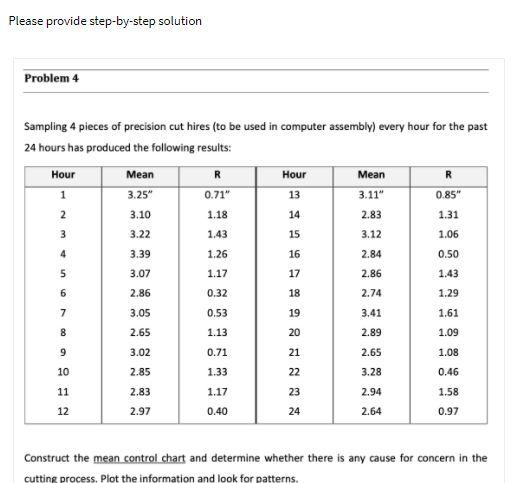
Question: Please provide step-by-step solution Problem 4 Sampling 4 pieces of precision cut hires (to be used in computer assembly) every hour for the past 24

Please provide step-by-step solution Problem 4

Please provide step-by-step solution Problem 4 Sampling 4 pieces of precision cut hires (to be used in computer assembly) every hour for the past 24 hours has produced the following results: Hour Mean R Hour Mean 3.25" 0.71" 13 3.11" 0.85" R 1 2 3.10 1.18 14 2.83 1.31 3 3.22 1.43 15 3.12 1.06 4 3.39 16 2.84 0.50 1.26 1.17 5 3.07 17 2.86 1.43 6 2.86 18 2.74 1.29 7 3.05 19 3.41 1.61 8 2.65 0.32 0.53 1.13 0.71 1.33 20 2.89 1.09 9 3.02 21 2.65 1.08 10 2.85 22 3.28 0.46 11 2.83 1.17 23 2.94 1.58 12 2.97 0.40 24 2.64 0.97 Construct the mean control chart and determine whether there is any cause for concern in the cutting process. Plot the information and look for patterns

Step by Step Solution

There are 3 Steps involved in it

1 Expert Approved Answer
Step: 1 Unlock blur-text-image
Question Has Been Solved by an Expert!

Get step-by-step solutions from verified subject matter experts

Step: 2 Unlock
Step: 3 Unlock

Students Have Also Explored These Related General Management Questions!