

Question: PLEASE PROVIDE THE CODE FOR EACH STEP AND ANSWER THE QUESTIONS! For this assignment, you will be using the Ice Cream Dataset:https://www.kaggle.com/datasets/tysonpo/ice-cream-dataset The dataset has
PLEASE PROVIDE THE CODE FOR EACH STEP AND ANSWER THE QUESTIONS!
For this assignment, you will be using the Ice Cream Dataset:https://www.kaggle.com/datasets/tysonpo/ice-cream-dataset
The dataset has two files: products.csv, which contains information about individual ice cream flavors, and reviews.csv, which contains reviews from individuals.
products dataset: https://drive.google.com/file/d/1NRg2ZDOYynhIJHsBkG5Khr2G6TojY55Z/view?usp=sharing
reviews dataset: https://drive.google.com/file/d/1OmViL8jbwU386sjNsJtPOhC9G3qQSIJV/view?usp=sharing
------------------------------------------------------------------------------------------------------------------------------------------------------------
Part 1: Descriptive analysis
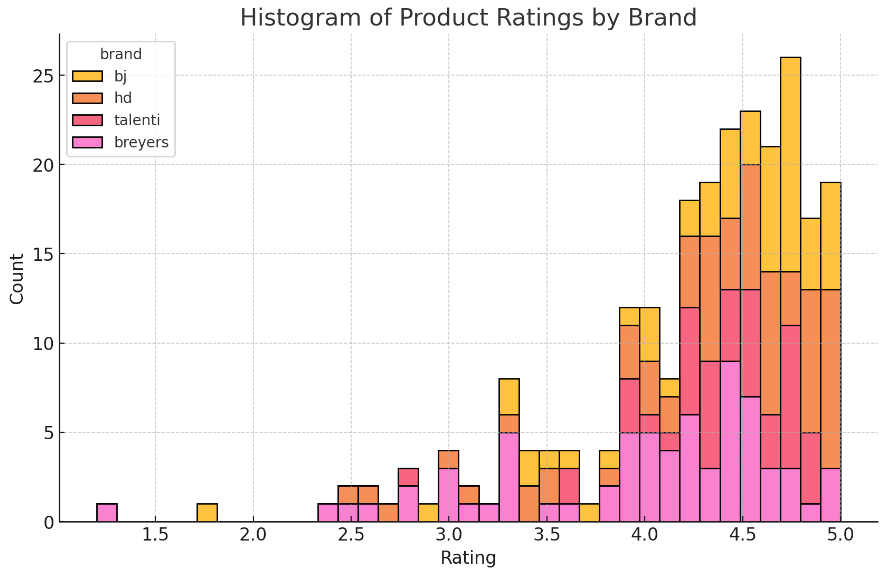
1.3 Product ratings histogram
Using the products dataset, make a histogram of the product ratings ranging from 1 to 5 (inclusive) with a bin width of 0.1. Use the brand of the ice cream as the color and stack the values across the brands for each bar (i.e. don't overlap them).
What do you notice about the overall distribution of ratings and the ratings for the brands?
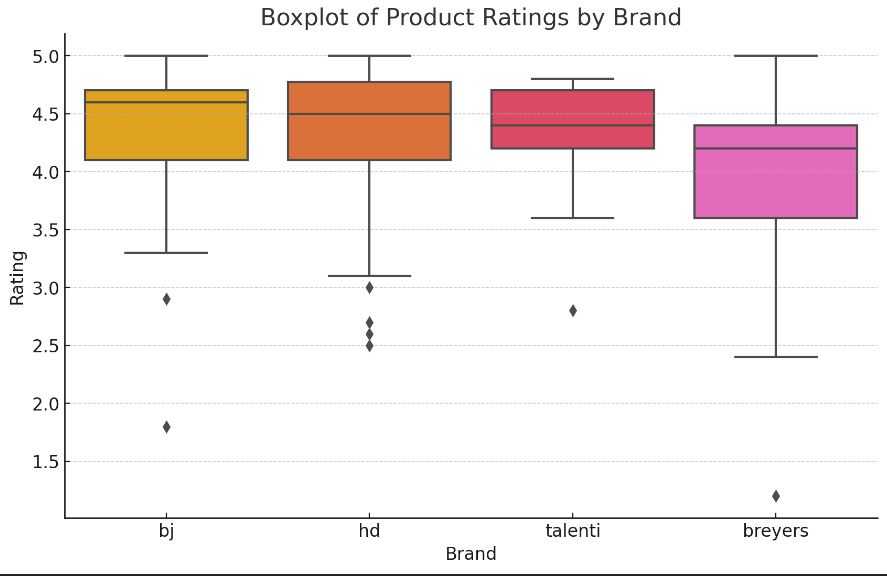
1.4 Product ratings boxplot
Again using the products dataset, make a boxplot of the product ratings, separated by brand. Is there any brand that has notably better/worse ratings than the others? Is there any brand that has a notably larger range of values?
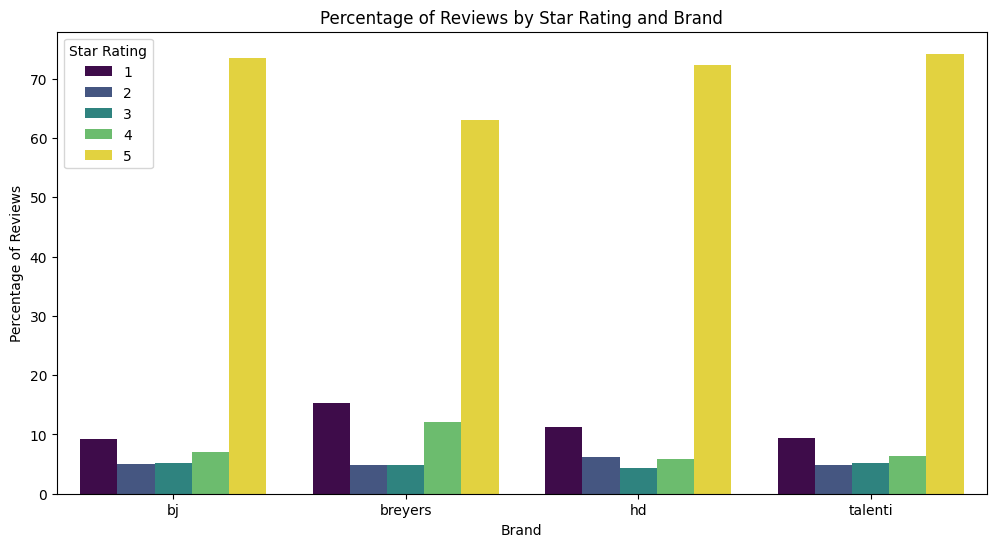
1.5 Star ratings barplot
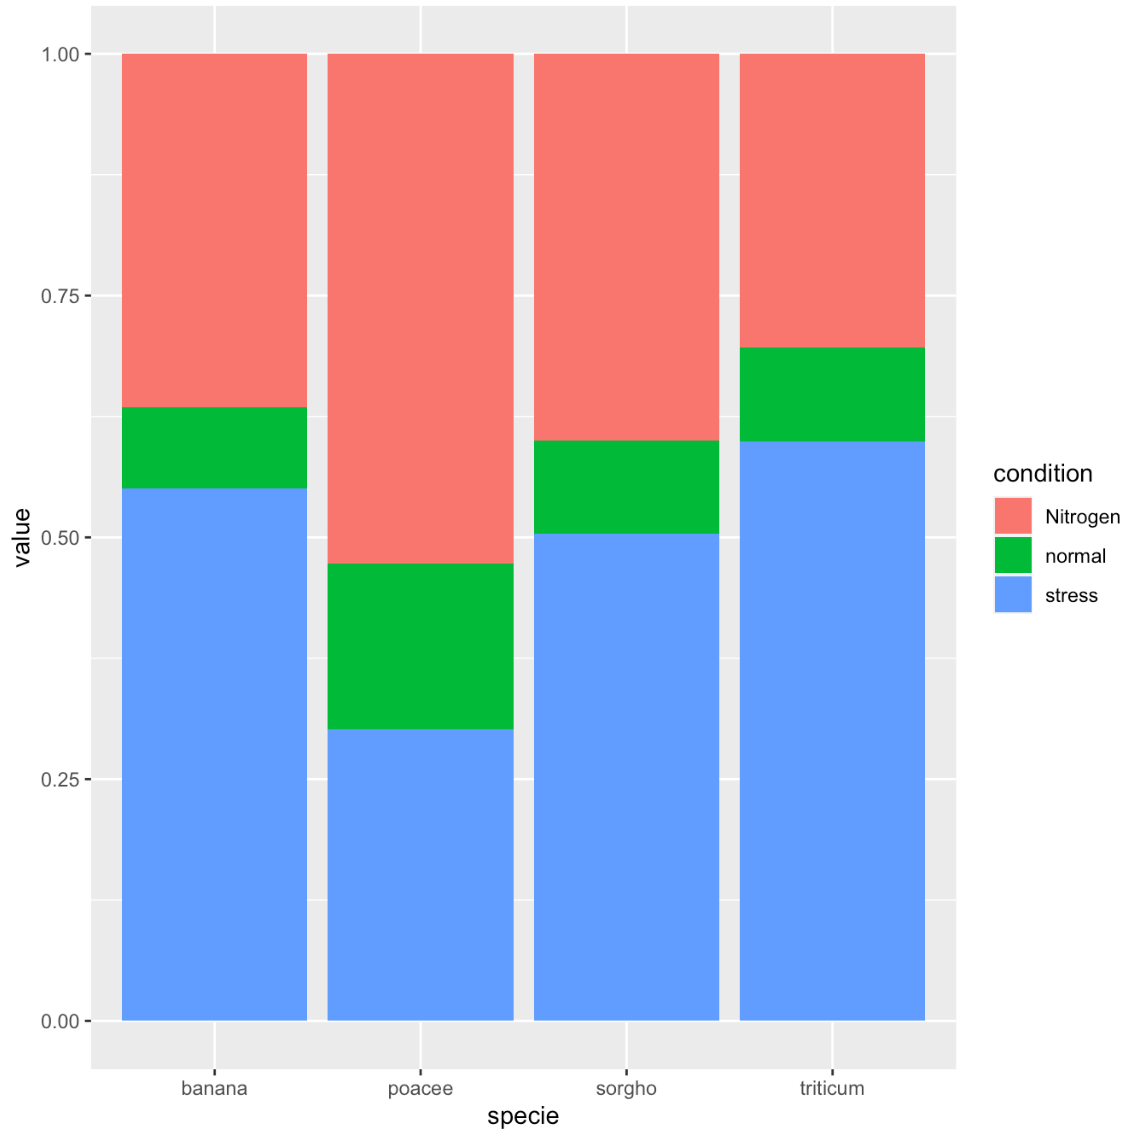
Now, using the reviews dataset, make a barplot showing the brand of ice cream along the x-axis, the percent of reviews along the y-axis, and the number of stars given as a color. With this plot, each rectangle should indicate the percentage of reviews with a particular number of stars given to a brand. Organize your plot such that the total percentage across each of the four bars (one for each brand) is 100% and the number of stars in the reviews are ordered 1-5.
Is there any brand with proportionally fewer 5-star reviews? What about proportionally more 1-star reviews?
(Hint: your final plot should resemble the plot in the picture below, but instead of 'specie' along the x-axis, it should be brands and your colors should be the star ratings)
Step by Step Solution
There are 3 Steps involved in it

Get step-by-step solutions from verified subject matter experts