

Question: Please provide the solutions to the problems given below- ## Explain the data from figure 1 ## Explain the differences in (a) and (b) parts
Please provide the solutions to the problems given below-
## Explain the data from figure 1
## Explain the differences in (a) and (b) parts in figure 2
## Try to recreate with R or Octave, as close as possible, the data from the figure 1. Functions needed are: runif (R) rand (Octave) for uniform distribution and rnorm (R) randn() (Octave) for the normal distribution
a. explain how you can recreate 1
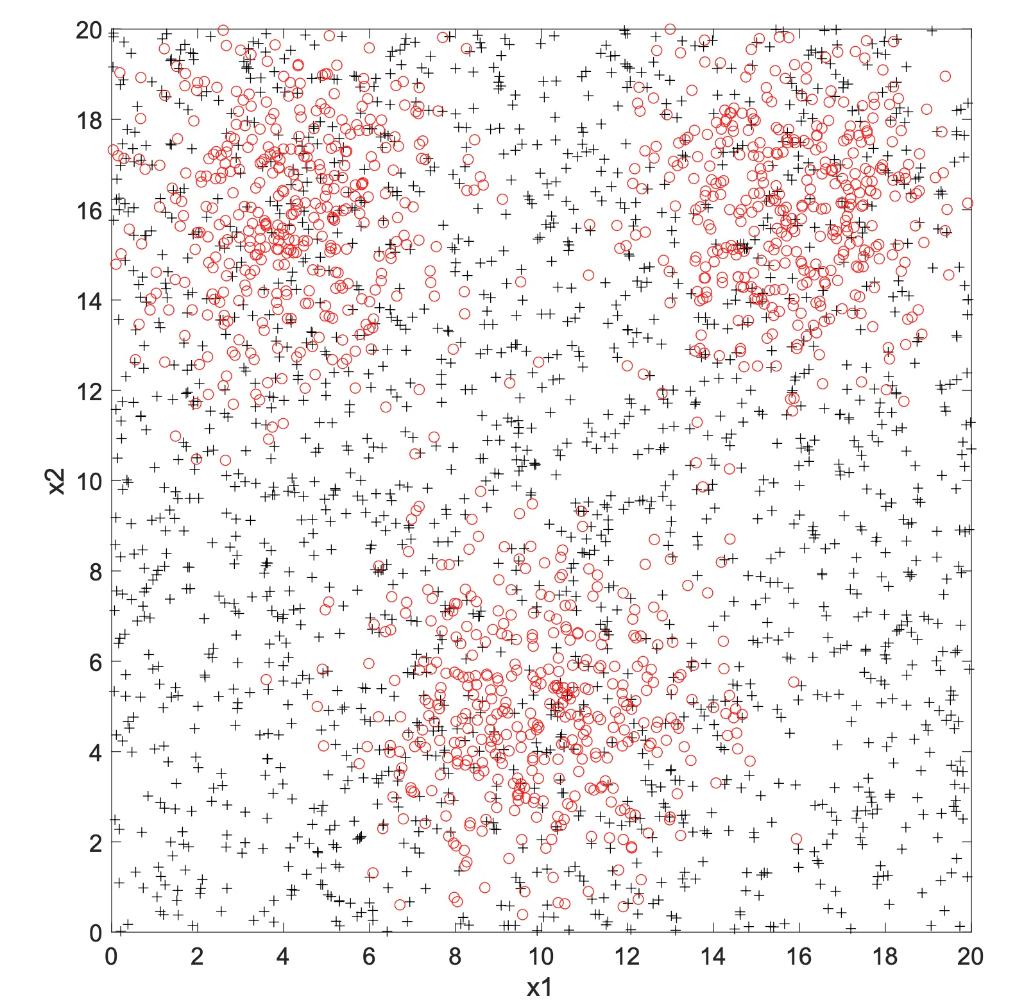
b. compare and discuss my figure 3 with the figure you created
## Based on the figure 3, or your data created, explain how you would make a decision tree to classify '+' and 'o' similarly to the way it was done in the left tree in figure 2
In your opinion, why is it practical or useful to simulate the data for the classification?
Figure 1
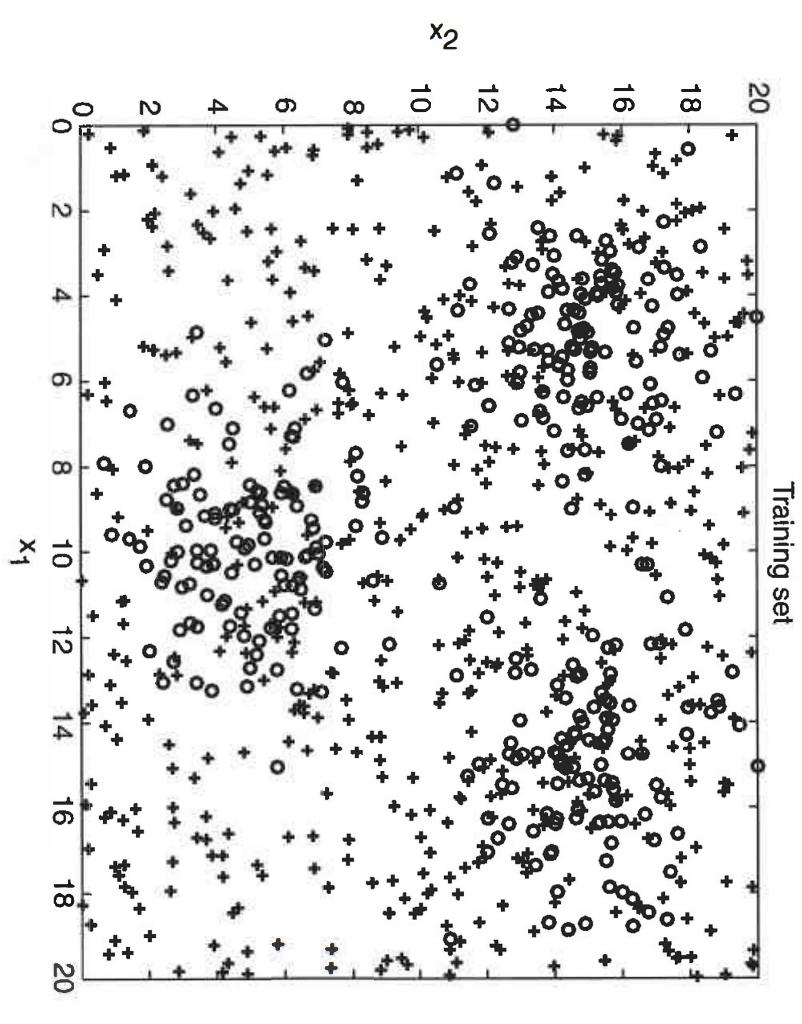
Figure 2
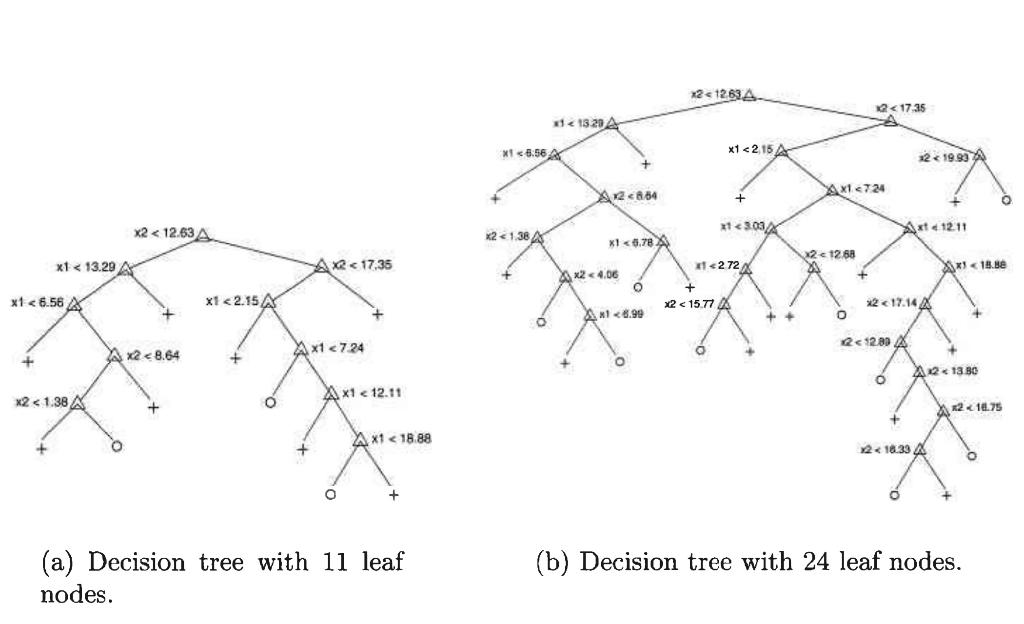
Figure 3
(a) Decision tree with 11 leaf (b) Decision tree with 24 leaf nodes. nodes
Step by Step Solution
There are 3 Steps involved in it

Get step-by-step solutions from verified subject matter experts