

Question: Please put steps for me to understand PLEASE DO UCLr and UCL left A process at Amit Eynan Bottling Company that is considered in control
Please put steps for me to understand
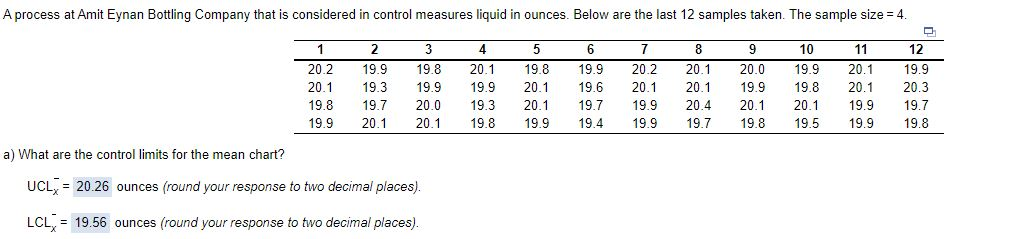
 PLEASE DO UCLr and UCL left
Step by Step Solution
There are 3 Steps involved in it
1 Expert Approved Answer
Step: 1 Unlock

Question Has Been Solved by an Expert!
Get step-by-step solutions from verified subject matter experts
Step: 2 Unlock
Step: 3 Unlock