

Question: please quickly They are all one question Complete the description of the graph below: Number of Tourists in Millions in London Per Year (2015-2021) 50
please quickly
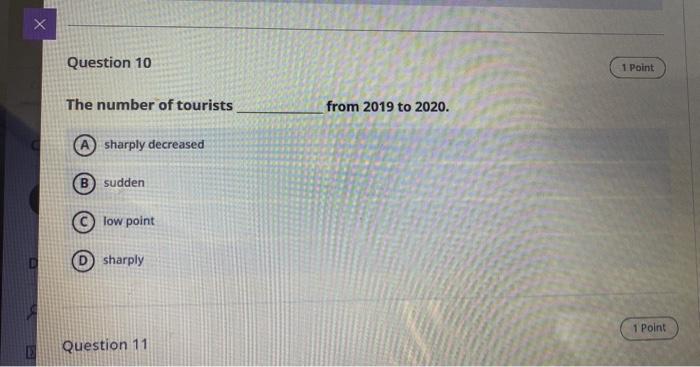
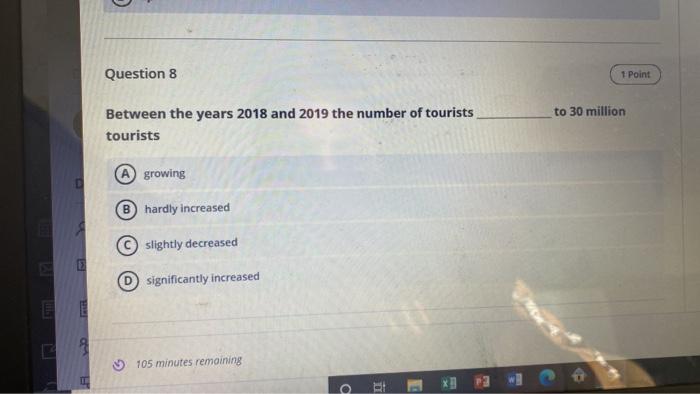
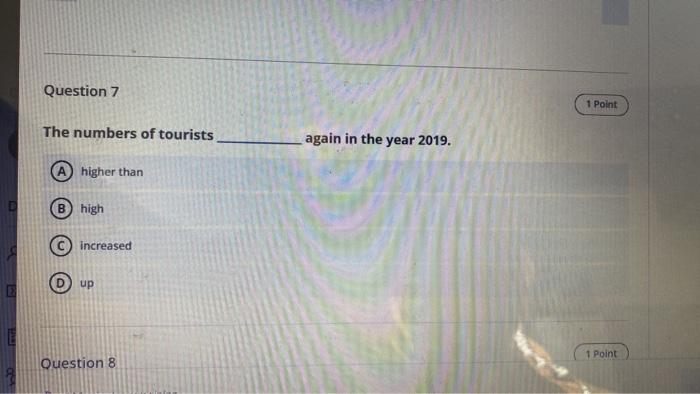
Complete the description of the graph below: Number of Tourists in Millions in London Per Year (2015-2021) 50 45 Mon 40 31 Million 31 Mi 30 30 24 Mon Number of Tourists (in Millions) 20 11 00 10 Million 10 0 2015 2016 2017 2018 2019 2020 2021 Year Question 10 1 Point The number of tourists from 2019 to 2020. A sharply decreased B sudden low point sharply 1 Point E Question 11 Question 8 1 Point to 30 million Between the years 2018 and 2019 the number of tourists tourists A growing B hardly increased slightly decreased O significantly increased E 9 105 minutes remaining E o Question 7 1 Point The numbers of tourists again in the year 2019. higher than B high increased up 1 Point Question 8 Question 9 1 Point In 2017, the number of tourists reached its at 45 million tourists. peak B high up long D 1 Point E Question 10 1 Maps 11 della Question 11 1 Point The number of tourists was between the years 2015 to 2016. smaller B steady bigger D medium REPORT WRITING: The Executive Summary / The Abstract They are all one question 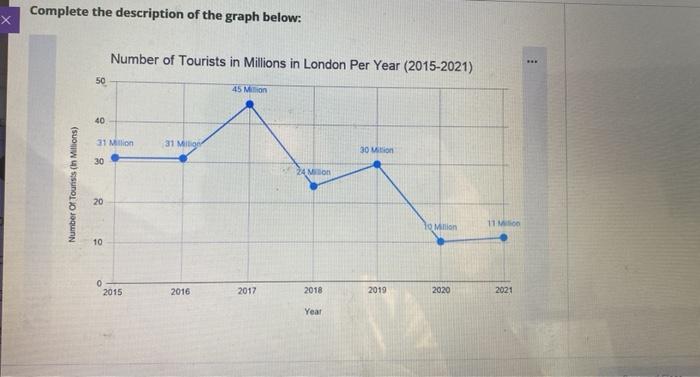
Step by Step Solution
There are 3 Steps involved in it
1 Expert Approved Answer
Step: 1 Unlock

Question Has Been Solved by an Expert!
Get step-by-step solutions from verified subject matter experts
Step: 2 Unlock
Step: 3 Unlock