Question: Please Read and answer the questions How do the net costs per card compare for each card category: Current structure vs. Outsourced to China vs.
Please Read and answer the questions
- How do the "net" costs per card compare for each card category:
- Current structure vs.
- Outsourced to China vs.
- Factory of the future
- What's the lowest cost alternative for each card category?
- What combination of alternatives provides the total lowest cost for AG?
- How much can they save in total (annually in millions of dollars)?
- What are the strategic pros and cons to be considered before outsourcing?
Notes/assumptions:
- Shipping costs are cents per card (for all categories)
- Ignoreinventoryholdingcosts
- AssumetheFactoryoftheFutureinvestment is evenly amortized on all applicable units over 15 years
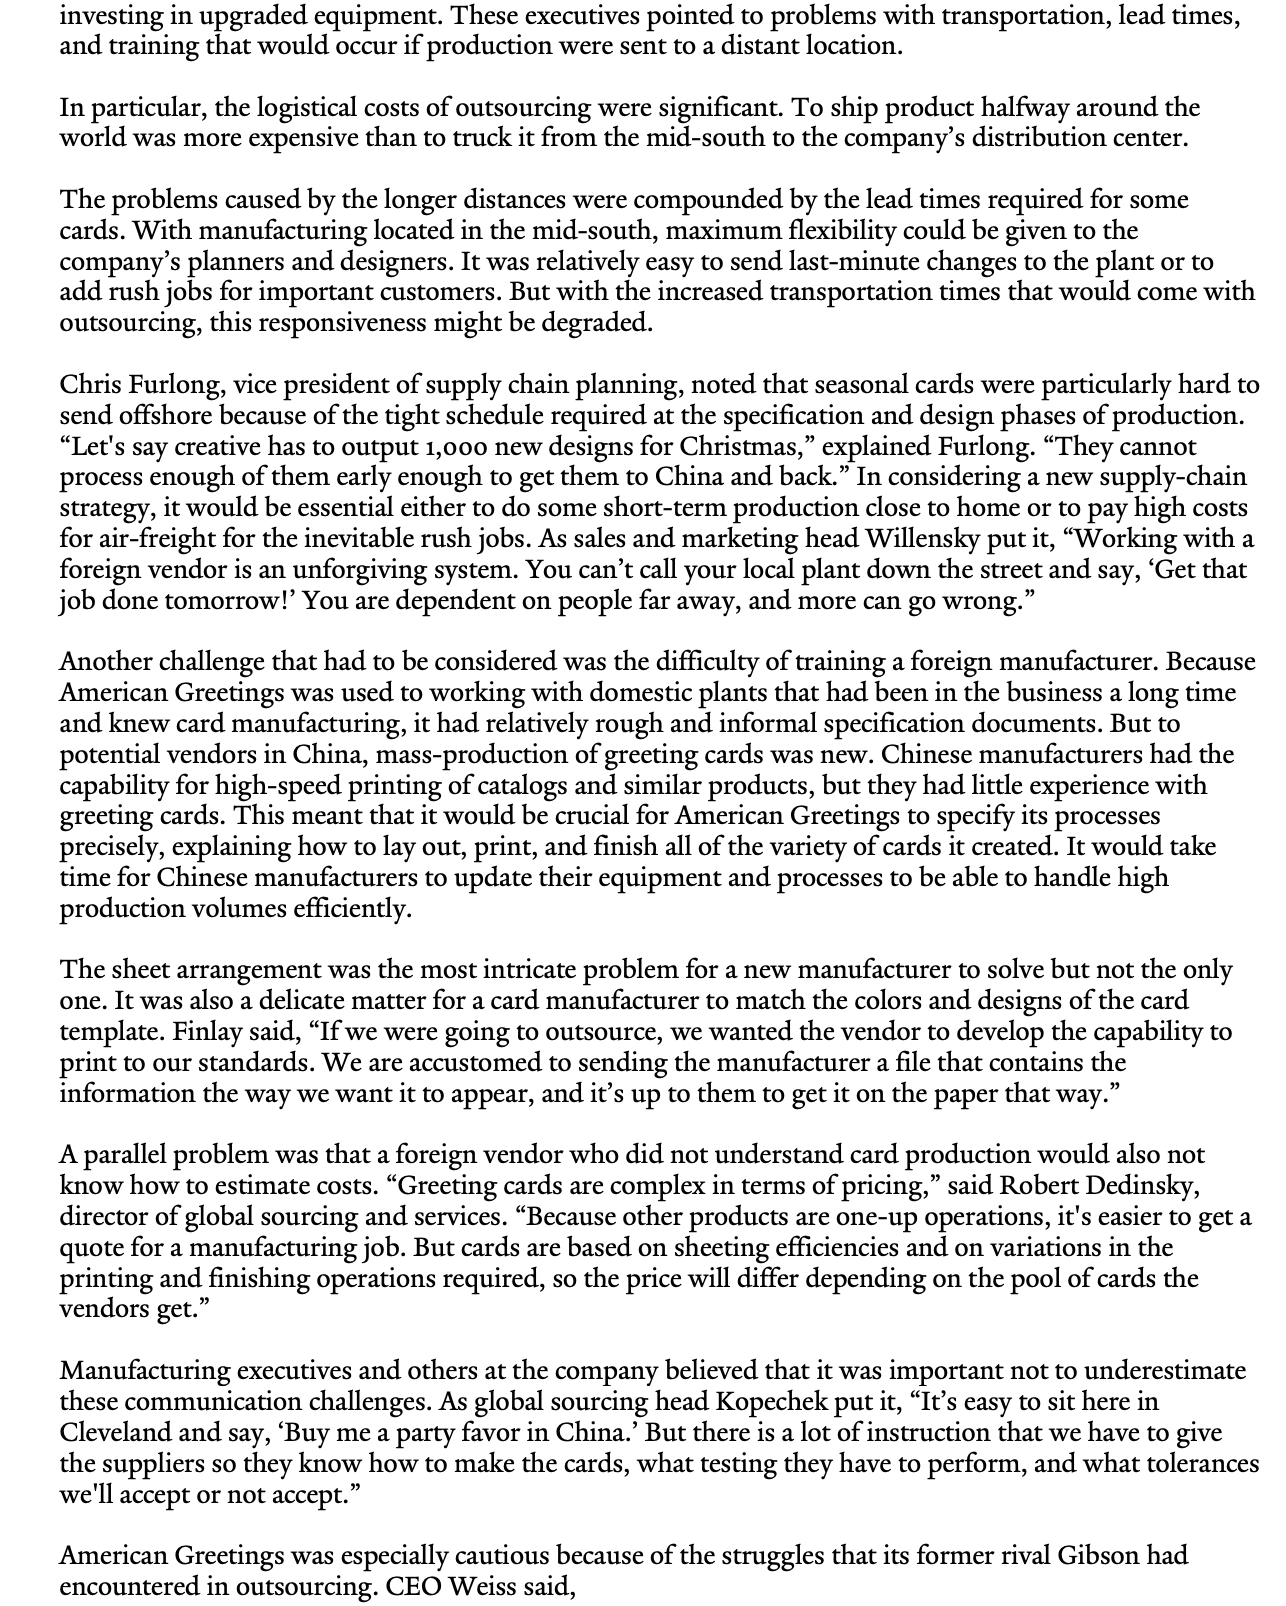
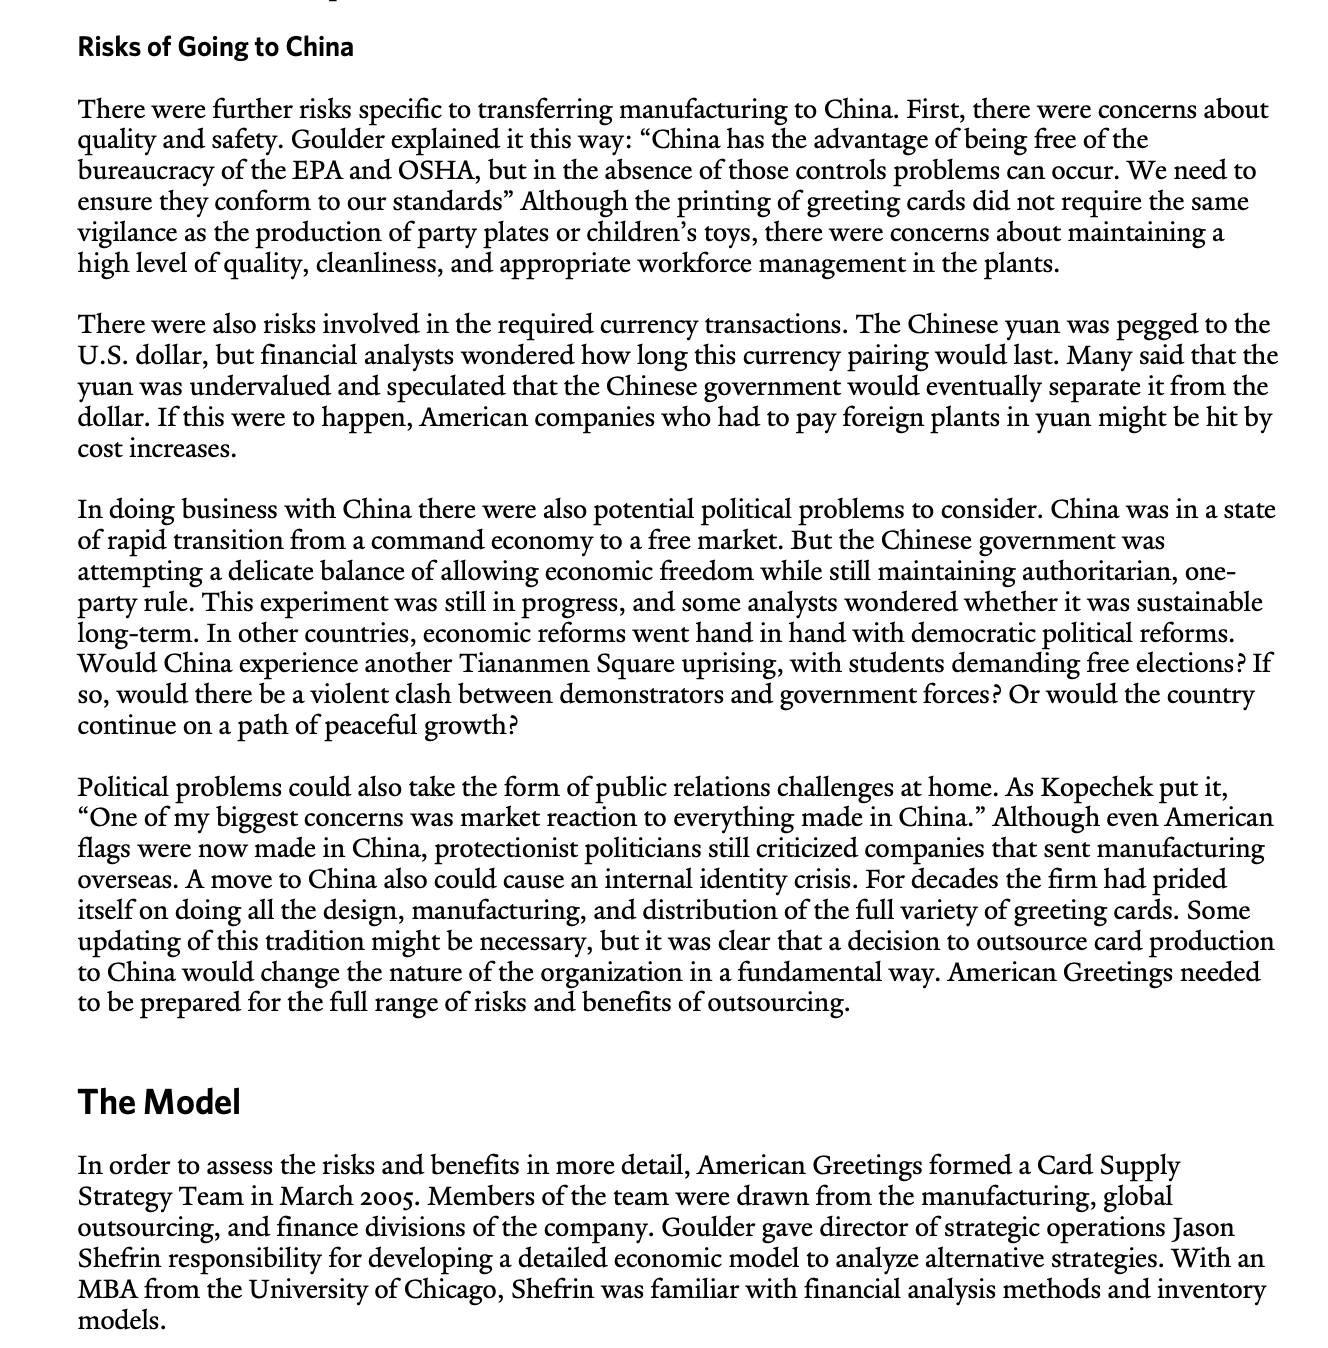
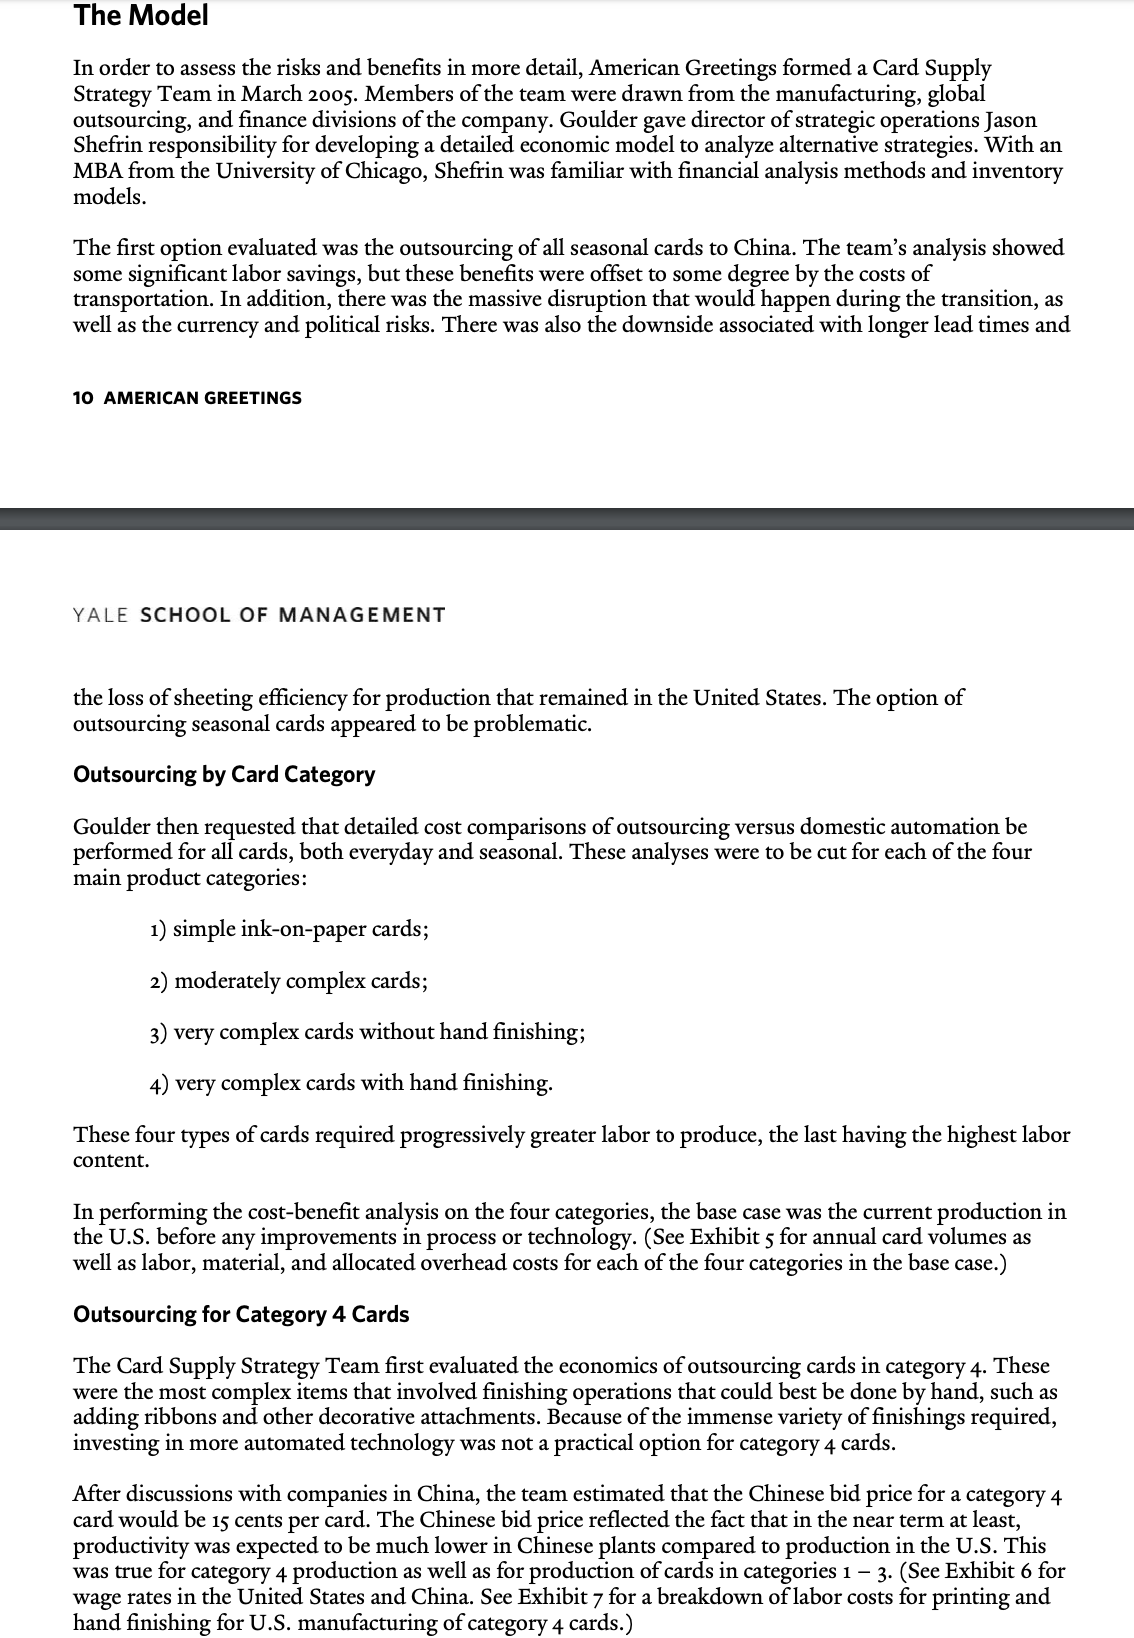
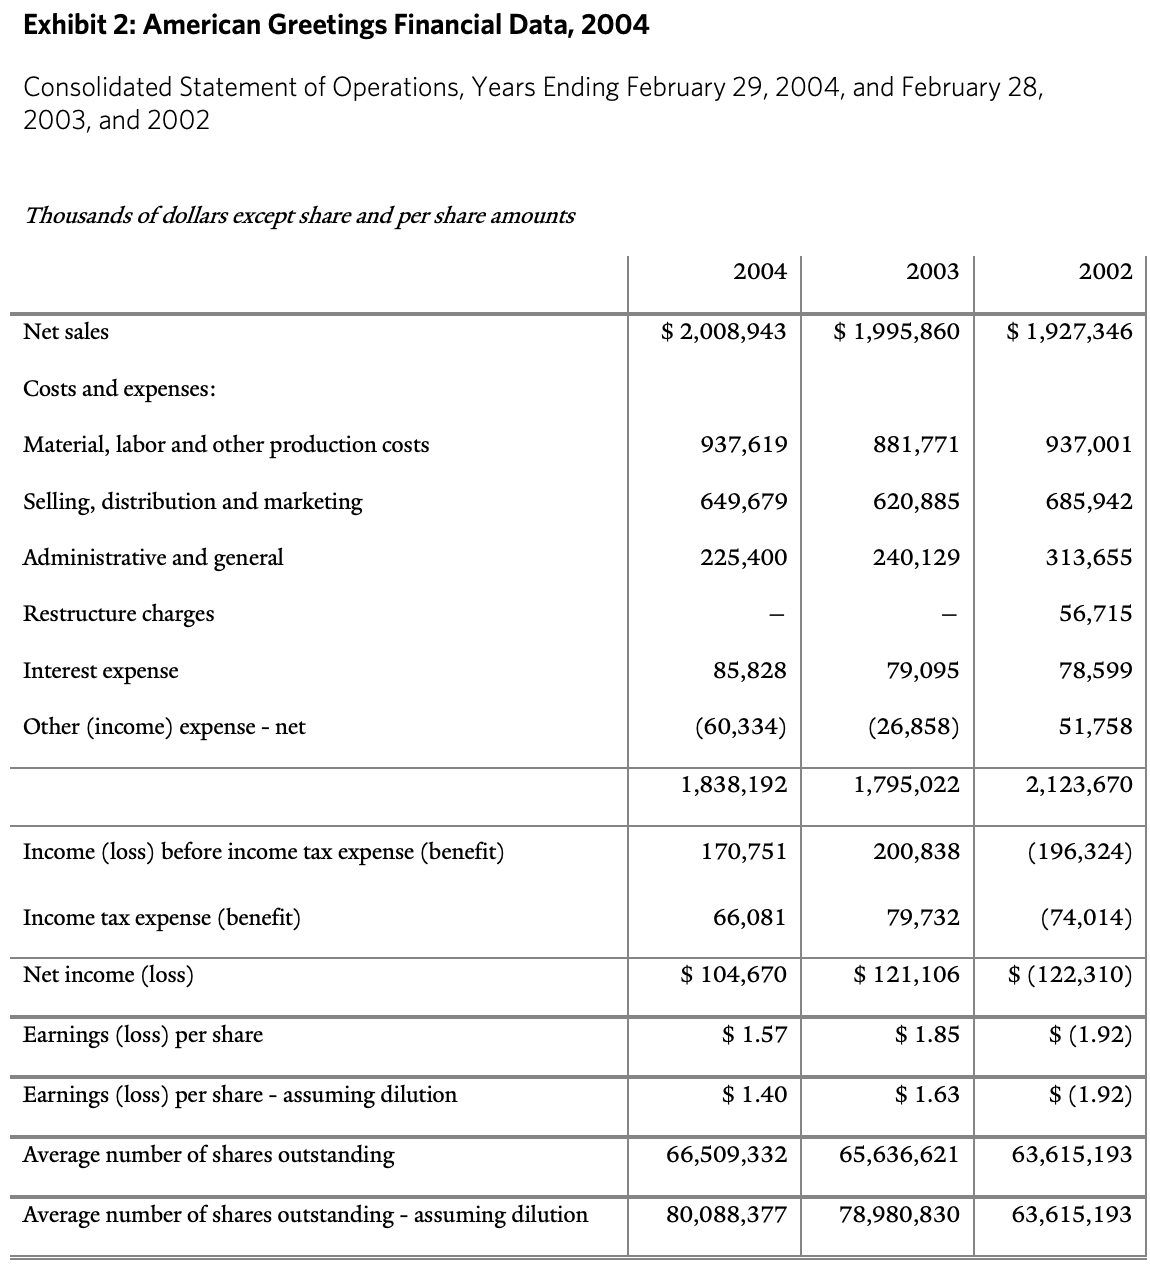
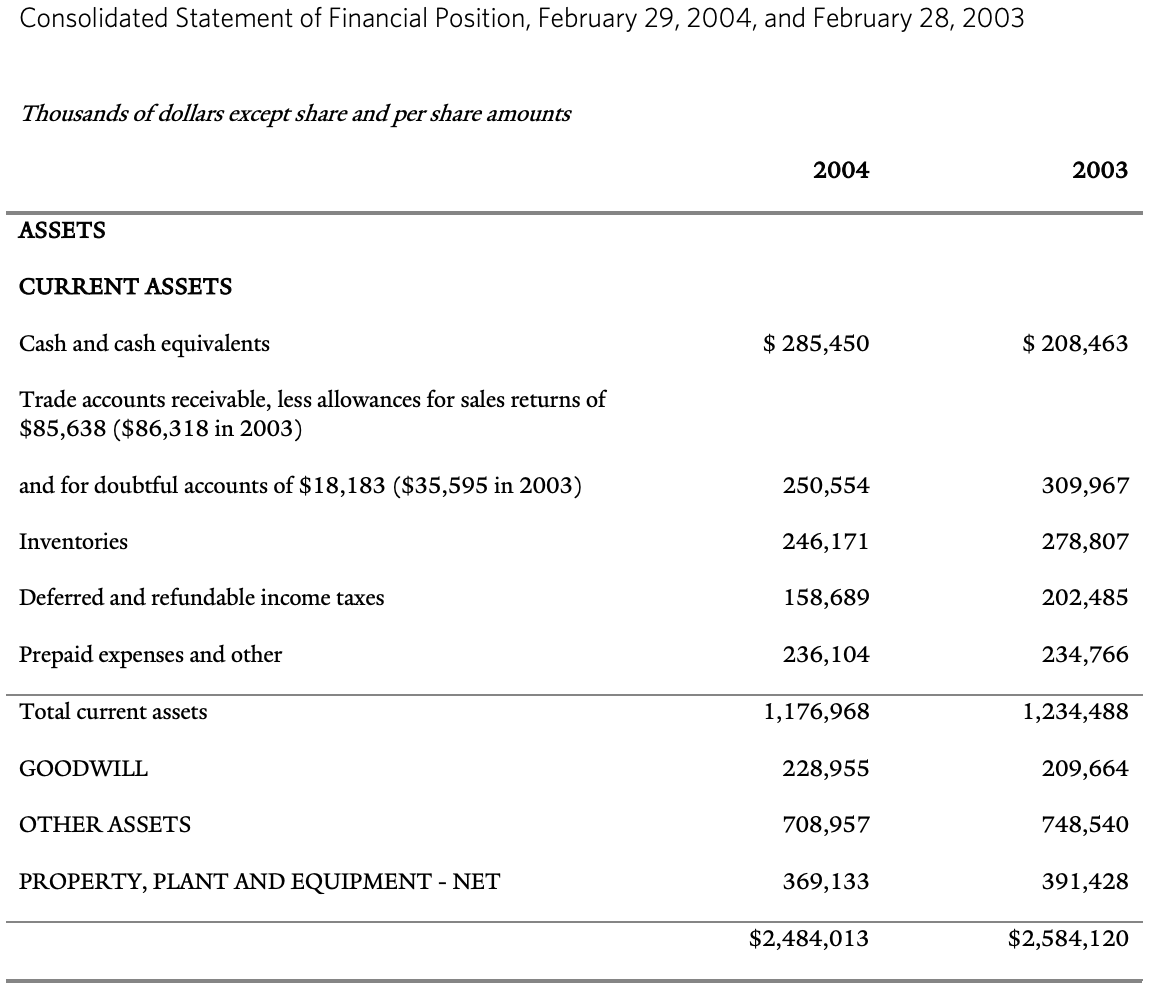
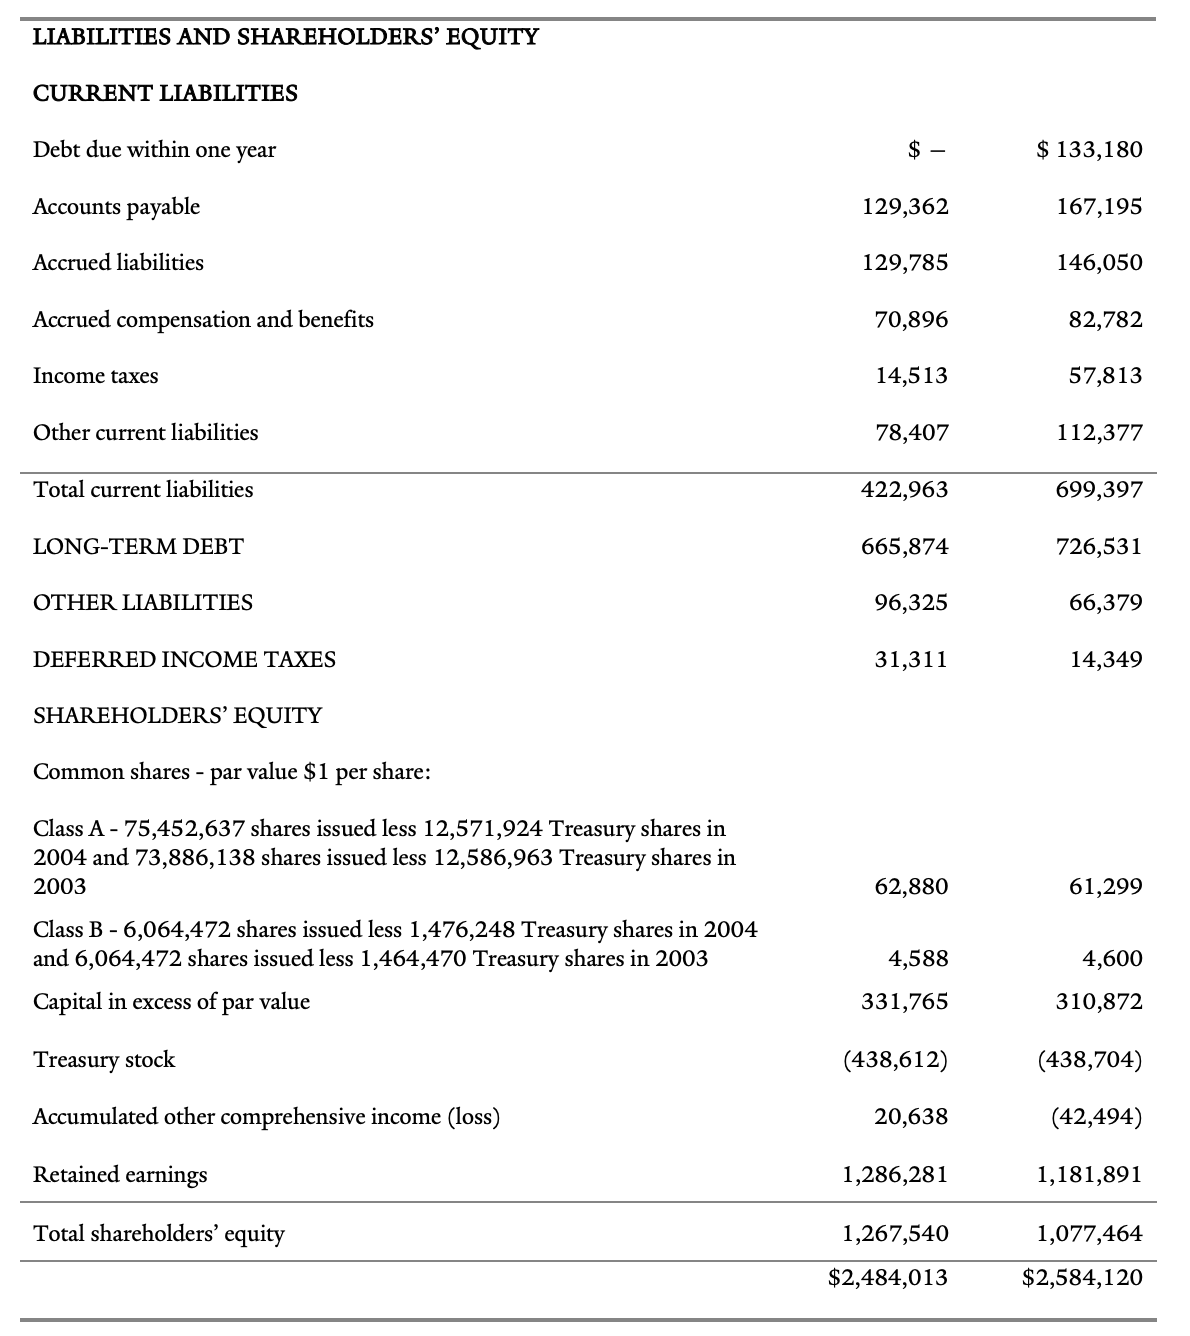
Cost-Cutting Options: Automate or Outsource By the early zooos it was clear that American Greetings would have to improve the efciency of its operations. Steve Wlensky, senior vice president and executive sales and marlazting officer, recalled, \"When I began with the company in 2002, the thing that struck me was that our costs were high, we had redundancy in our plants, and the supply chain was a nightmare.\" American Greetings was considering two approaches to reducing manufacturing costs: streamlining and automating domestic production, and outsourcing to China. It seemed to some in the company that outsourcing most or all production was the obvious solution. But top executives did not want to jump to conclusions without studying the problem. For a number of months the company engaged 1n an internal debate about the merits of1mprov1ng its existing systems versus transferring manufacturing overseas. The Case for Outsourcing Many senior managers assumed that outsourcing was both desirable and inevitable. As CEO Weiss remembered, \"Initially there was a bias in favor of sending manufacturing offshore. The reasoning was, 'Everybody is doing it. We haven't done the math yet, but that's going to be the answer.\" Indeed, some of the company's competitors had already moved in that direction. For example, in 1998 Gibson Greetings decided to outsource manufacturing of all of its products. Not only was outsourcing a trend; in some ways, it seemed to be a logical extension of what had happened at American Greetings a generation earlier. Originally all manufacturing had been done at company headquarters in Cleveland. But beginning in the 19705, the company had moved production from the highly unionized industrial Midwest to Kentucky and Tennessee. This brought the advantages not only of cheaper labor and higher productivity but also lower transportation costs, because manufacturing was now done in the center of the country. At rst glance, outsourcing seemed to be a similar decision. As Goulder recalled, \"Many long-time company executives drew an analogy and suggested that the outsourcing decision was the same as when we went to the mid-south.\" American Greetings was already sourcing gift bags from Asia, so why not greeting cards?I The greatest advantage to outsourcing seemed to be the expected reduction in labor costs. Gary Kopechek, vice president of global sourcing and services, pointed out that because every card was unique, the business involved not only variable labor but a high amount of overhead, as well. \"We get huge seasonal spikes Christmas, Valentine's Day, Mother's Day on top of our everyday business, which is relatively at, \" said Kopechek. \"That's problematic in keeping our work force fully utilized. Outsourcing to vendors allows them not only to produce our high labor content cards but also to schedule our seasonal spikes into their overall production mix. \" Outsourcing manufacturing to China or Mexico seemed to offer a significant labor advantage. The initial design and planning phases needed to remain local, but manufacturing could be done anywhere. The Case for Automation Other executives, especially those on the manufacturing side of the company, believed that they could best maintain the quality and efciency of operations by streamlining manufacturing in the United States and investing in upgraded equipment. These executives pointed to problems with transportation, lead times, and training that would occur 1f production were sent to a distant location. In particular, the logistical costs of outsourcing were signicant. To ship product halfway around the world was more expensive than to truck it from the mid-south t0 the company's distribution center. The problems caused by the longer distances were compounded by the lead times required for some cards. With manufacturing located in the mid-south, maximum exibility could be given to the company's planners and designers. It was relatively easy to send last-minute changes to the plant or to add rush jobs for important customers. But with the increased transportation times that would come with outsourcing, this responsiveness might be degraded. Chris Furlong, vice president of supply chain planning, noted that seasonal cards were particularly hard to send offshore because of the tight schedule required at the specication and design phases of production. \"Let's say creative has to output 1,000 new designs for Christmas,\" explained Furlong. \"They cannot process enough of them early enough to get them to China and back.\" In considering a new supply-chain strategy, it would be essential either to do some short-term production close to home or to pay high costs for air-freight for the inevitable rush jobs. As sales and marketing head W1llensky put it, \"Working with a foreign vendor is an unforgiving system. You can't call your local plant down the street and say, 'Get that job done tomorrow!' You are dependent on people far away, and more can go wrong.\" Another challenge that had to be considered was the difficulty of training a foreign manufacturer. Because American Greetings was used to working with domestic plants that had been in the business a long time and knew card manufacturing, it had relatively rough and informal specication documents. But to potential vendors in China, mass-production of greeting cards was new. Chinese manufacturers had the capability for high-speed printing of catalogs and similar products, but they had little experience with greeting cards. This meant that it would be crucial for American Greetings to specify its processes precisely, explaining how to lay out, print, and nish all of the variety of cards it created. It would take time for Chinese manufacturers to update their equipment and processes to be able to handle high production volumes efficiently. The sheet arrangement was the most intricate problem for a new manufacturer to solve but not the only one. It was also a delicate matter for a card manufacturer to match the colors and designs of the card template. Finlay said, \"If we were going to outsource, we wanted the vendor to develop the capability to print to our standards. We are accustomed to sending the manufacturer a le that contains the information the way we want it to appear, and it's up to them to get it on the paper that way.\" A parallel problem was that a foreign vendor who did not understand card production would also not know how to estimate costs. \"Greeting cards are complex in terms of pricing,\" said Robert Dedinsky, director of global sourcing and services. \"Because other products are one-up operations, it's easier to get a quote for a manufacturing job. But cards are based on sheeting efficiencies and on variations in the printing and nishing operations required, so the price will differ depending on the pool of cards the vendors get.\" Manufacturing executives and others at the company believed that it was important not to underestimate these communication challenges. As global sourcing head Kopechek put it, \"It's easy to sit here in Cleveland and say, 'Buy me a party favor in China.' But there is a lot of instruction that we have to give the suppliers so they know how to make the cards, what testing they have to perform, and what tolerances we'll accept or not accept.\" American Greetings was especially cautious because of the struggles that its former rival Gibson had encountered in outsourcing. CEO Weiss said, Risks of Going to China There were further risks specic to transferring manufacturing to China. First, there were concerns about quality and safety. Goulder explained it this way: \"China has the advantage of being free of the bureaucracy of the EPA and OSHA, but in the absence of those controls problems can occur. We need to ensure they conform to our standards\" Although the printing of greeting cards did not require the same vigilance as the production of party plates or children's toys, there were concerns about maintaining a high level of quality, cleanliness, and appropriate workforce management in the plants. There were also risks involved in the required currency transactions. The Chinese yuan was pegged to the U.S. dollar, but nancial analysts wondered how long this currency pairing would last. Many said that the yuan was undervalued and speculated that the Chinese government would eventually separate it from the dollar. If this were to happen, American companies who had to pay foreign plants in yuan might be hit by cost increases. In doing business with China there were also potential political problems to consider. China was in a state of rapid transition from a command economy to a free market. But the Chinese government was attempting a delicate balance of allowing economic freedom while still maintaining authoritarian, one- party rule. This experiment was still in progress, and some analysts wondered whether it was sustainable long-term. In other countries, economic reforms went hand in hand with democratic political reforms. Would China experience another Tiananmen Square uprising, with students demanding free elections? If so, would there be a violent clash between demonstrators and government forces? Or would the country continue on a path of peaceful growth? Political problems could also take the form of public relations challenges at home. As Kopechek put it, \"One of my biggest concerns was market reaction to everything made in China.\" Although even American ags were now made in China, protectionist politicians still criticized companies that sent manufacturing overseas. A move to China also could cause an internal identity crisis. For decades the rm had prided itselfon doing all the design, manufacturing, and distribution of the full variety of greeting cards. Some updating of this tradition might be necessary, but it was clear that a decision to outsource card production to China would change the nature of the organization in a fundamental way. American Greetings needed to be prepared for the full range of risks and benets of outsourcing. The Model In order to assess the risks and benets in more detail, American Greetings formed a Card Supply Strategy Team in March 2005. Members of the team were drawn from the manufacturing, global outsourcing, and nance divisions of the company. Goulder gave director of strategic operations Jason Shefrin responsibility for developing a detailed economic model to analyze alternative strategies. With an MBA from the University of Chicago, Shefrin was familiar with nancial analysis methods and inventory models. The Model In order to assess the risks and benets in more detail, American Greetings formed a Card Supply Strategy Team in March 2005. Members of the team were drawn from the manufacturing, global outsourcing, and nance divisions of the company. Goulder gave director of strategic operations Jason Shefrin responsibility for developing a detailed economic model to analyze alternative strategies. With an MBA from the University of Chicago, Shefrin was familiar with nancial analysis methods and inventory models. The rst option evaluated was the outsourcing of all seasonal cards to China. The team's analysis showed some signicant labor savings, but these benets were offset to some degree by the costs of transportation. In addition, there was the massive disruption that would happen during the transition, as well as the currency and political risks. There was also the downside associated with longer lead times and 10 AMERICAN GREETINGS YALE SCHOOL OF MANAGEMENT the loss of sheeting efciency for production that remained in the United States. The option of outsourcing seasonal cards appeared to be problematic. Outsourcing by Card Category Goulder then requested that detailed cost comparisons of outsourcing versus domestic automation be performed for all cards, both everyday and seasonal. These analyses were to be cut for each of the four main product categories: 1) simple inkonpaper cards; 2) moderately complex cards; 3) very complex cards without hand nishing; 4) very complex cards with hand nishing. These four types of cards required progressively greater labor to produce, the last having the highest labor content. In performing the costbenet analysis on the four categories, the base case was the current production in the US. before any improvements in process or technology. (See Exhibit 5 for annual card volumes as well as labor, material, and allocated overhead costs for each of the four categories in the base case.) Outsourcing for Category 4 Cards The Card Supply Strategy Team rst evaluated the economics of outsourcing cards in category 4. These were the most complex items that involved nishing operations that could best be done by hand, such as adding ribbons and other decorative attachments. Because of the immense variety of nishings required, investing in more automated technology was not a practical option for category 4. cards. After discussions with companies in China, the team estimated that the Chinese bid price for a category 4. card would be 15 cents per card. The Chinese bid price reected the fact that in the near term at least, productivity was expected to be much lower in Chinese plants compared to production in the US. This was true for category 4. production as well as for production of cards in categories 1 3. (See Exhibit 6 for wage rates in the United States and China. See Exhibit 7 for a breakdown of labor costs for printing and hand nishing for U.S. manufacturing of category 4 cards.) Outsourcing for Category 4 Cards The Card Supply Strategy Team rst evaluated the economics of outsourcing cards in category 4. These were the most complex items that involved nishing operations that could best be done by hand, such as adding ribbons and other decorative attachments. Because of the immense variety of nishings required, investing in more automated technology was not a practical option for category 4 cards. After discussions with companies in China, the team estimated that the Chinese bid price for a category 4 card would be 15 cents per card. The Chinese bid price reected the fact that in the near term at least, productivity was expected to be much lower in Chinese plants compared to production in the U.S. This was true for category 4 production as well as for production of cards in categories 1 - 3. (See Exhibit 6 for wage rates in the United States and China. See Exhibit 7 for a breakdown of labor costs for printing and hand nishing for U.S. manufacturing of category 4 cards.) Transportation, Lead Time, and Inventory Considerations After coming up with a basic per-card cost for outsourcing category 4 cards, the team wanted to factor in the impact of transportation costs, lead time, and inventory costs for outsourcing any of the categories of cards. The costs of shipping from China were straightforward. (See Exhibit 8 for transportation costs from China to the U.S.) The impact of outsourcing on lead time and inventory was more difcult to calculate. Total card production consisted of seasonal cards and everyday cards, with total volume across the four categories divided evenly between the two types. Outsourcing to China would only affect the inventory levels for everyday cards. Order quantities for seasonal cards were set well before the start of each seasonal campaign, and She'in believed the quantities would remain the same whether the cards were produced in China or in the U.S. Printing and hand nishing category 4 cards in China would add eight weeks to the average lead time. There was concern throughout the organization, particularly among manufacturing 11 AMERICAN GREETINGS YALE SCHOOL OF MANAGEMENT managers, about the impact on safety stock resulting from the much longer lead time required for product outsourced to China. For everyday cards American Greetings used an economic order quantity with uncertainty (Qbr) model to determine its order quantities and reorder points. For each SKU, it set the reorder point and therefore the safety stock by specifying a ll rate of 98 percent. In assessing the impact on safety stock, Shefrin treated the six-week domestic production lead time as constant, but he recognized that the estimated 14-week lead time from China was an average and that actual lead time might be longer because of bad weather, port problems, or other delays. He had no data on actual lead times from China and therefore had to make For everyday cards American Greetings used an economic order quantity with uncertainty (Qbr) model to determine its order quantities and reorder points. For each SKU, it set the reorder point and therefore the safety stock by specifying a ll rate of 98 percent. In assessing the impact on safety stock, Shefrin treated the six-week domestic production lead time as constant, but he recognized that the estimated 14-week lead time from China was an average and that actual lead time might be longer because of bad weather, port problems, or other delays. He had no data on actual lead times from China and therefore had to make an estimate of variability based on judgment alone. He assumed that the standard deviation of the lead time from China would be about four weeks. In order to compensate for the variable lead time, Shefrin decided to add one standard deviation to the mean lead time. In other words, the lead time could be treated as a constant 18 weeks. Shefrin wanted to compare the cost of carrying safety stock for everyday items under the China option to the cost of carrying safety stock for the current system of producing category 4. cards in the US. He found that there were 1,571 everyday SKUs in category 4. With 50 percent of total volume comprising everyday cards, he determined that the annual average demand per card was about was 60 ,,ooo which was 5,000 per month or 5,ooo/4 = 1,250 per week. The company used an order quantity Qequivalent to six weeks of demand or 7,500 cards, and the firm' s inventory carrying percentage was 10 percent. From historical data Shefrin estimated that the standard deviation of weekly demand for this\" average' SKU was 600. (See Exhibit 9 for a summary of inventory-related data). Assuming demands from week to week were independent, he had enough information to calculate the safety stock for the average SKU under the China option and the safety stock under the US. option. Automation versus Outsourcing for the Other Three Categories Finally, for categories 1 to 3, Shefrin and the team examined the costs and benets of investing in new technology compared to outsourcing to China. First the team developed a factory-of-thelture plan that called for an investment of about $30 million across all card categories. Compared to current manufacturing in the U.S., the analysis showed an internal rate of return of about 40 percent and a payback period of about two years. The main effect of these investments would be to reduce the number of labor hours required for domestic production. See Exhibit 10 for the manufacturing costs for categories 1-3 if the factory-of-the-future technology plan were implemented. Second, after discussions with Chinese factory owners, Shefrin estimated bid prices for cards in categories 1-3 at the factory in China. For categories 1, 2, and 3 respectively, these were 3.6 cents, 5.9 cents, and 9.8 cents per card. What Next? As American Greetings pondered its options, top executives were committed to looking at the problem as objectively as possible. CEO Zev Weiss said, \"We needed to have a neutral view, and we needed to have our head of manufacturing and our head of global sourcing lay out the best possible cases on both sides. Just because outsourcing made sense for toys did not mean that it would also make sense for greeting cards.\" The more the company looked at the problem, the more complex it seemed to be. Executives wondered if the answer lay somewhere in between complete outsourcing and complete domestic production. \"It's not Exhibit 2: American Greetings Financial Data, 2004 Consolidated Statement of Operations, Years Ending February 29, 2004, and February 28, 2003, and 2002 Thousands of dollars except share and per share amounts 2004 2003 2002 Net sales $ 2,008,943 $ 1,995,860 $ 1,927,346 Costs and expenses: Material, labor and other production costs 937,619 881,771 937,001 Selling, distribution and marketing 649,679 620,885 685,942 Administrative and general 225,400 240,129 313,655 Restructure charges 56,715 Interest expense 85,828 79,095 78,599 Other (income) expense - net (60,334) (26,858) 51,758 1,838,192 1,795,022 2,123,670 Income (loss) before income tax expense (benefit) 170,751 200,838 (196,324) Income tax expense (benefit) 66,081 79,732 (74,014) Net income (loss) $ 104,670 $ 121,106 $ (122,310) Earnings (loss) per share $ 1.57 $ 1.85 $ (1.92) Earnings (loss) per share - assuming dilution $ 1.40 $ 1.63 $ (1.92) Average number of shares outstanding 66,509,332 65,636,621 63,615,193 Average number of shares outstanding - assuming dilution 80,088,377 78,980,830 63,615,193Consolidated Statement of Financial Position, February 29, 2004, and February 28, 2003 Thousands of dollars except share and per share amounts 2004 2003 ASSETS CURRENT ASSETS Cash and cash equivalents $ 285,450 $ 208,463 Trade accounts receivable, less allowances for sales returns of $85,638 ($86,318 in 2003) and for doubtful accounts of $18,183 ($35,595 in 2003) 250,554 309,967 Inventories 246,171 278,807 Deferred and refundable income taxes 158,689 202,485 Prepaid expenses and other 236,104 234,766 Total current assets 1,176,968 1,234,488 GOODWILL 228,955 209,664 OTHER ASSETS 708,957 748,540 PROPERTY, PLANT AND EQUIPMENT - NET 369,133 391,428 $2,484,013 $2,584,120LIABILITIES AND SHAREHOLDERS' EQUITY CURRENT LIABILITIES Debt due within one year $ $ 133,180 Accounts payable 129,362 167,195 Accrued liabilities 1 29, 78 5 146,050 Accrued compensation and benets 70,896 82,782 Income taxes 14,513 57,813 Other current liabilities 78,407 1 1 2 ,3 77 LONG-TERM DEBT 665,874 726,53 1 OTHER LIABILITIES 96,325 66,3 79 DEFERRED INCOME TAES 3 1 ,3 1 1 14,349 SHAREHOLDERS' EQUITY Common shares par value $ 1 per share: Class A 75,452,637 shares issued less 12,571,924 Treasury shares in 2004 and 73,886,138 shares issued less 12,586,963 Treasury shares in 2003 62,880 61,299 Class B - 6,064,472 shares issued less 1,476,248 Treasury shares in 2004 and 6,064,472 shares issued less 1 ,464,470 Treasury shares in 2003 4,588 4,600 Capital in excess of par value 33 1,765 3 10,872 Treasury stock (438,6 1 2) (438, 704) Accumulated other comprehensive income (loss) 20,638 (42,494) Retained earnings 1,286,281 1,181,891 Total shareholders' equity 1 ,267,540 1,077,464 $2,484,013 $2,584,120 Exhibit 5: Volumes and U.S. Manufacturing Costs by Card Category, 2005 1 - Simple 2 - Moderately 3 - Very Complex 4 - Very Complex Complex without Hand Fin- with Hand Finish- Category ishing ing Volume 1,884,860,889 782,999,026 183,069,742 188,603,877 Direct Labor $21,850,266 $19,674,321 $9,235,666 $14,570,391 Indirect Labor $3,508,171 $2,941,694 $1,155,198 $1,190,120 Materials $21,663,947 $17,298,914 $8,382,630 $8,636,035 Allocated Overhead $15,225,529 $11,859,047 $653,993 $11,108,135 Total Cost $62,247,913 $51,773,976 $19,427,487 $35,504,680 1 - Simple 2 - Moderately 3 - Very Complex without 4 - Very Complex Complex Hand Finishing with Hand Finish- ing Category Cost per Card Cost per Card Cost per Card Cost per Card Direct Labor $0.012 $0.025 $0.050 $0.077 Indirect Labor $0.002 $0.004 $0.006 $0.006 Materials $0.011 $0.022 $0.046 $0.046 Allocated Overhead 800 0$ $0.015 $0.004 $0.059 Total $0.033 $0.066 $0. 106 $0. 188 Note: Cost per card equals cost (from previous table) divided by volume.Exhibit 9: Inventory Data Total Annual Volume: 3 billion cards Total Annual SKUs: 50,000 Annual Demand per SKU = 60,000 Average Monthly Demand per SKU = 5,000 Average Weekly Demand per SKU = 1,250 Standard Deviation of Weekly Demand = 600 Order Quantity for Average Card = 7,500 Inventory Carrying Percentage = 10% Exhibit 10: Labor Costs by Category for Factory of the Future Factory of the Future Savings 1 - Simple 2 - Moderately Complex 3 - Very Complex without Category Hand Finish % Labor Reduction 27% 53% 14% Cost per Card Cost per Card Cost per Card Direct Labor $0.008 $0.012 $0.043 Indirect Labor $0.001 $0.002 $0.005 Total (including materials and overhead) $0.029 $0.051 $0.098Exhibit 6: Wage Rates in U.S. Plants and China Exhibit 7: Direct Labor Costs for U.S. Production of Categoryt! Cards (Very Complex with Hand Finishing) Direct Labor Total $14,570,391 $1,190,120 Exhibit 8: Transportation Costs from China Average Ocean Rate per Container Other Costs per Container* $537.95 Total Cost per Container $3,200.18 Cubic Feet per Container 2,1 12 Cost per Cubic Foot 55 1 .5 1 5 Transportation Conversions: 4 cards = 1 unit 72 units = 1 "C" Box 1 "C" Box = 23" x 8.5" x 7.5" = 0.85 cubic feet *Other China-related costs include customs, fuel, and trucking from U.S. ports to distribution centers