

Question: PLEASE READ ENTIRE QUESTION AND ANSWER USING MATLAB! WILL LEAVE A GOOD REVIEW IF DONE CORRECTLY! Part II: The /magnitude. Ol representation of the frequency
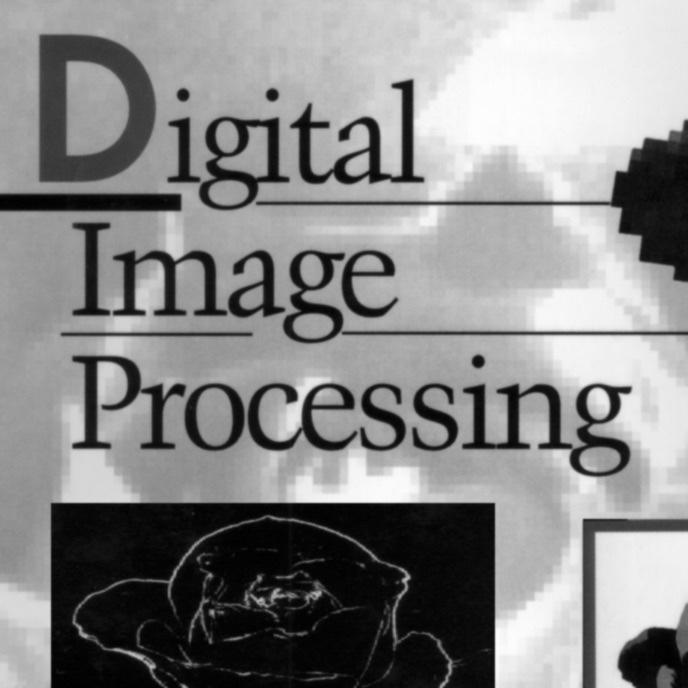
Part II: The /magnitude. Ol representation of the frequency domain Begin by obtaining the magnitude, ) representation of the image in file DIPbook_cover. In general, independent of images, a complex number is representable as F(u,v) = R(u,v) +jx I(u,v) where j is the imaginary basis (square root of -1). The magnitude (a.k.a., spectrum) is M(u, v) = [R(u, v)] + [1(u, v)? (The magnitude is also known as the frequency spectrum.) The other component, the phase angle, is 8(u, v) = tan-(K). Assume the the Fourier transform is (f(x,y) => R(.) Flu,v)). For each component of F(u,v), compute the magnitude and phase angle. Display the inverse transform of the magnitude, M(u,v). Next, display the inverse transform of the phase angle matrix, uv) as the imaginary numbers of a frequency spectrum for which the real part is all one's. One first must convert the phase angles to complex numbers. One does so by multiplying each by), that is (1 x). (Hint: in Matlab, the keyword, 1), is the imaginary basis.) What to Hand In For Part I: Submit to CANVAS. ("Project 5 Part ") (1) the code, (2) the original spatial image, (3) the spectrum which we have informally called the Fourier transform of the original image, (4) the spectrum after the Fourier transform has been multiplied by the notch filter, (5) the spatial image following the application of the notch filter in the frequency domain, and (6) an image depicting the notch filter. Examine Fig. 4.64 or Fig. 5.16 in the textbook for an example of a good illustration of results. CAREFULLY LABEL THE IMAGES For Part II: Submit to CANVAS. ("Project 5 Part 11") (1) The code, (2) The original spatial image, (3) The spectrum of the original image, (4) the spatial view of the magnitude array, (inverse FT of Mfu,v)), (5) the spatial view of the phase angle array, (inverse FT of jx{u,v). Examine Fig. 4.26 in the textbook for an example of a good illustration of results. CAREFULLY LABEL THE IMAGES What to expect The spatial form of the magnitude array will not show much of anything - just a cloudy appearance. The spatial form of the phase angle array should show faintly the original spatial image. If not, not to worry. It could be the vagaries of the arithmetic used by your system - dynamic ranging, etc. You might consider adjusting the brightness or contrast (gamma correction or equalization, but it is not necessary that you do so. Digital Image Processing Part II: The /magnitude. Ol representation of the frequency domain Begin by obtaining the magnitude, ) representation of the image in file DIPbook_cover. In general, independent of images, a complex number is representable as F(u,v) = R(u,v) +jx I(u,v) where j is the imaginary basis (square root of -1). The magnitude (a.k.a., spectrum) is M(u, v) = [R(u, v)] + [1(u, v)? (The magnitude is also known as the frequency spectrum.) The other component, the phase angle, is 8(u, v) = tan-(K). Assume the the Fourier transform is (f(x,y) => R(.) Flu,v)). For each component of F(u,v), compute the magnitude and phase angle. Display the inverse transform of the magnitude, M(u,v). Next, display the inverse transform of the phase angle matrix, uv) as the imaginary numbers of a frequency spectrum for which the real part is all one's. One first must convert the phase angles to complex numbers. One does so by multiplying each by), that is (1 x). (Hint: in Matlab, the keyword, 1), is the imaginary basis.) What to Hand In For Part I: Submit to CANVAS. ("Project 5 Part ") (1) the code, (2) the original spatial image, (3) the spectrum which we have informally called the Fourier transform of the original image, (4) the spectrum after the Fourier transform has been multiplied by the notch filter, (5) the spatial image following the application of the notch filter in the frequency domain, and (6) an image depicting the notch filter. Examine Fig. 4.64 or Fig. 5.16 in the textbook for an example of a good illustration of results. CAREFULLY LABEL THE IMAGES For Part II: Submit to CANVAS. ("Project 5 Part 11") (1) The code, (2) The original spatial image, (3) The spectrum of the original image, (4) the spatial view of the magnitude array, (inverse FT of Mfu,v)), (5) the spatial view of the phase angle array, (inverse FT of jx{u,v). Examine Fig. 4.26 in the textbook for an example of a good illustration of results. CAREFULLY LABEL THE IMAGES What to expect The spatial form of the magnitude array will not show much of anything - just a cloudy appearance. The spatial form of the phase angle array should show faintly the original spatial image. If not, not to worry. It could be the vagaries of the arithmetic used by your system - dynamic ranging, etc. You might consider adjusting the brightness or contrast (gamma correction or equalization, but it is not necessary that you do so. Digital Image Processing
Step by Step Solution
There are 3 Steps involved in it

Get step-by-step solutions from verified subject matter experts