

Question: Please read the question carefully and answer them specfically according to the way it needs to be solved. The teacher is very specific and likes
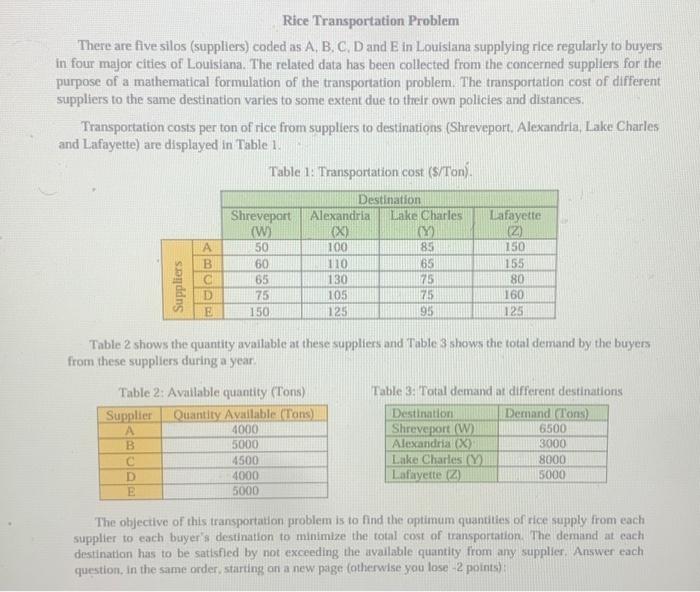
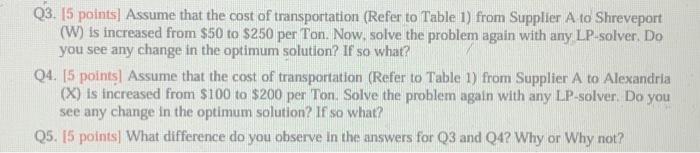
Rice Transportation Problem There are five silos (suppliers) coded as A, B, C, D and E in Louisiana supplying rice regularly to buyers in four major cities of Louisiana. The related data has been collected from the concerned suppliers for the purpose of a mathematical formulation of the transportation problem. The transportation cost of different suppliers to the same destination varies to some extent due to their own policies and distances. Transportation costs per ton of rice from suppliers to destinations (Shreveport, Alexandria, Lake Charles and Lafayette) are displayed in Table 1. Table 1: Transportation cost (\$/Ton). Table 2 shows the quantity available at these suppliers and Table 3 shows the total demand by the buyers from these suppliers during a year: Table 2: Avallable quantity (Tons) Table 3: Total demand at different destinations The objective of this transportation problem is to find the optimum quantities of rice supply from each supplier to each buyer's destination to minimize the total cost of transportation. The demand at cach question, in the same order, starting on a new pige (atherwise you lose -2 points): Q3. [5 points] Assume that the cost of transportation (Refer to Table 1) from Supplier A to Shreveport (Wh) is increased from $50 to $250 per Ton. Now, solve the problem again with any LP-solver. Do you see any change in the optimum solution? If so what? Q4. [5 points] Assume that the cost of transportation (Refer to Table 1) from Supplier A to Alexandria (X) is increased from $100 to $200 per Ton. Solve the problem again with any LP-solver. Do you see any chamge in the optlmum solutton? If so what? Q5. [5 points] What difference do you observe in the answers for Q3 and Q4? Why or Why not
Step by Step Solution
There are 3 Steps involved in it

Get step-by-step solutions from verified subject matter experts