

Question: ***please read the question. DON'T submit previous solutions because they are WRONG*** please ***please read the question. DON'T submit previous solutions because they are WRONG***
***please read the question. DON'T submit previous solutions because they are WRONG*** please
***please read the question. DON'T submit previous solutions because they are WRONG*** please
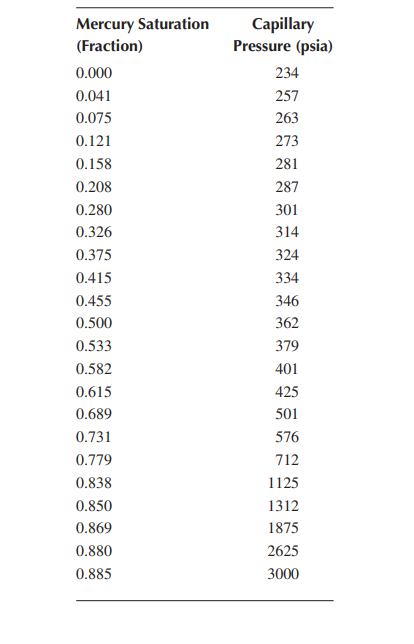
3.7 From the capillary pressure data presented in Problem 8.5, calculate the height of OWC and thickness of the transition zone in ft and map the reservoir in terms of fluid contacts, zones, and water saturation distribution. The FWL is at 0ft. Additional data include the reservoir oil and formation water IFT of 25 dynes /cm and a contact angle of 30 (values are representative of reservoir conditions). Oil and water densities can be taken as 45 and 65lbmass/ft3, respectively. \begin{tabular}{lc} \hline MercurySaturation(Fraction) & CapillaryPressure(psia) \\ 0.000 & 234 \\ 0.041 & 257 \\ 0.075 & 263 \\ 0.121 & 273 \\ 0.158 & 281 \\ 0.208 & 287 \\ 0.280 & 301 \\ 0.326 & 314 \\ 0.375 & 324 \\ 0.415 & 334 \\ 0.455 & 346 \\ 0.500 & 362 \\ 0.533 & 379 \\ 0.582 & 401 \\ 0.615 & 425 \\ 0.689 & 501 \\ 0.731 & 576 \\ 0.779 & 712 \\ 0.838 & 1125 \\ 0.850 & 1312 \\ 0.869 & 1875 \\ 0.880 & 2625 \\ 0.885 & 3000 \\ & \\ \hline \end{tabular}
Step by Step Solution
There are 3 Steps involved in it

Get step-by-step solutions from verified subject matter experts