

Question: Please recreate this R function into python to produce the plot in the picture. *******THIS IS THE R FUNCTION******** nrep=1000 #number of simulation replicates mu2=0
Please recreate this R function into python to produce the plot in the picture.
*******THIS IS THE R FUNCTION********
nrep=1000 #number of simulation replicates mu2=0 #true mean for sample #1 mu1vec=seq(from=0,to=2,by=0.05) #true mean for sample #2 sd1=1 #true SD for sample #1 sd2=1 #true SD for sample #2 Nvec=c(10,20,30,40,50) powmat=NULL #matrix that to store power values. powmat[i,j] =power for ith sample size and jth effect size
for(N1 in Nvec) { N2=N1 powvec
*******END OF R FUNCTION*******
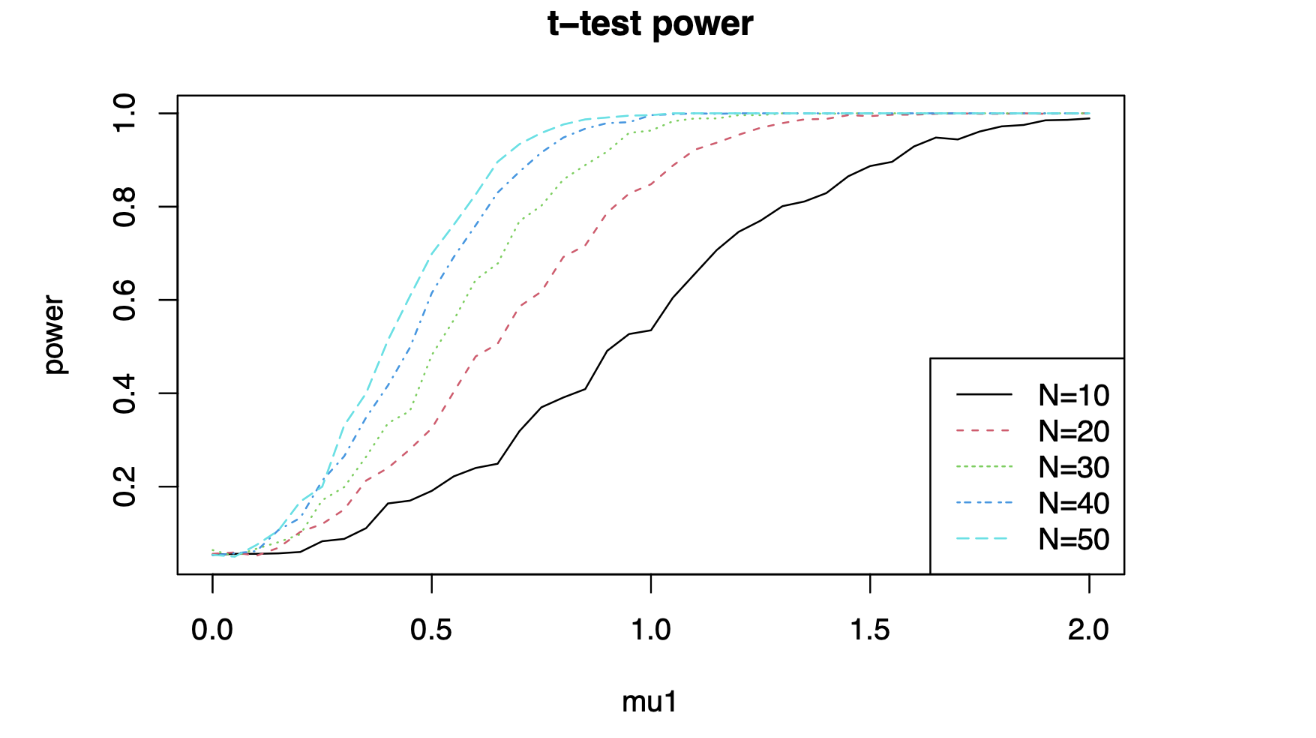
t-test power t-test power
Step by Step Solution
There are 3 Steps involved in it
1 Expert Approved Answer
Step: 1 Unlock

Question Has Been Solved by an Expert!
Get step-by-step solutions from verified subject matter experts
Step: 2 Unlock
Step: 3 Unlock