

Question: Please redo this problem, the code provided does not produce the bar plot required. The dataset provided in the answer is missing the percentages that
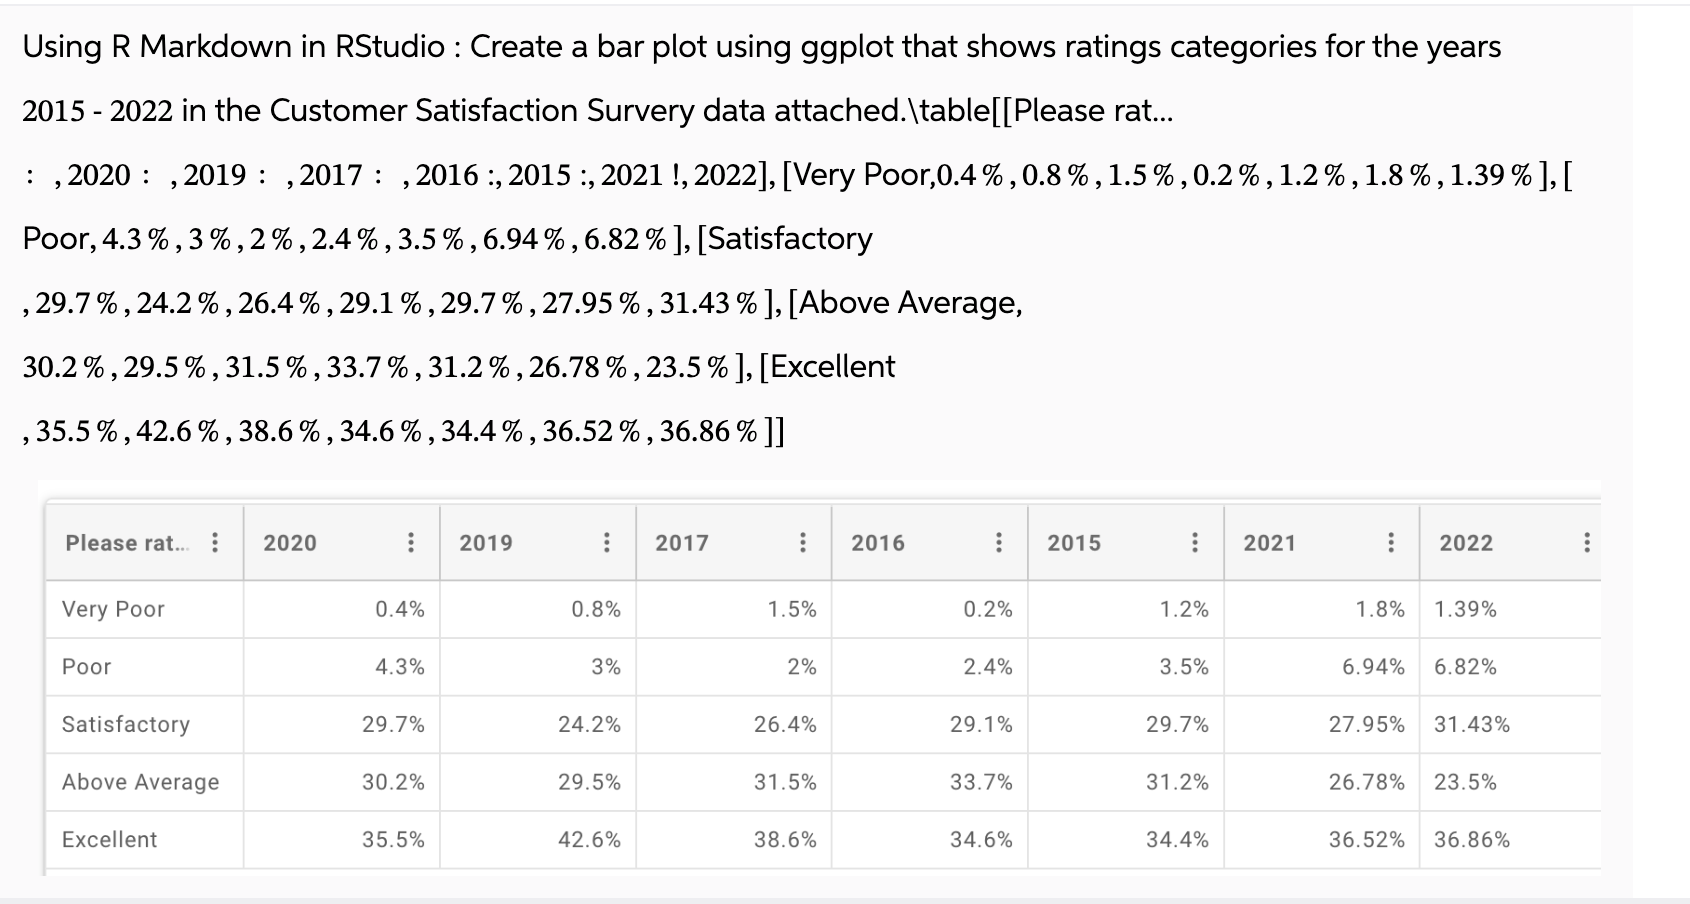
Please redo this problem, the code provided does not produce the bar plot required. The dataset provided in the answer is missing the percentages that are needed to produce the bar plot. Using R Markdown in RStudio : Create a bar plot using ggplot that shows ratings categories for the years
in the Customer Satisfaction Survery data attached.tablePlease rat...
: : : : : :
Poor, Satisfactory
Above Average,
Excellent
Step
The studio code to perfrom Bar plot is
install.packagesggplot # Only run this line if ggplot is not already installed
libraryggplot
ratingsdata data.frame
Year repc each
Rating repcVery Poor", "Poor", "Satisfactory", "Above Average", "Excellent" times
printratingsdata
ggplotratingsdata, aesx Year, y Percentage, fill Rating
geom barstat "identity", position "dodge"
labstitle "Customer Satisfaction Ratings
x "Year",
y "Percentage
thememinimal
scale fill brewerpalette "Set # Option to apply a color palette Error in geomblank:
Problem while computing aesthetics.
i Error occurred in the st layer.
Caused by error:
object 'Percentage' not found
Backtrace:
base localx
ggplot:::print.ggplotx
ggplot:::ggplotbuild.ggplotx
ggplot:::bylayer
ggplotlocal fl layersi d datai
l$computeaestheticsd plot
ggplotlocal computeaesthetics self self
Step by Step Solution
There are 3 Steps involved in it
1 Expert Approved Answer
Step: 1 Unlock

Question Has Been Solved by an Expert!
Get step-by-step solutions from verified subject matter experts
Step: 2 Unlock
Step: 3 Unlock