

Question: Please refer to the spreadsheet file (Unit 2 Supplemental Analysis.xls) for the analysis related to a hog feed project. United Feed is considering a proposal
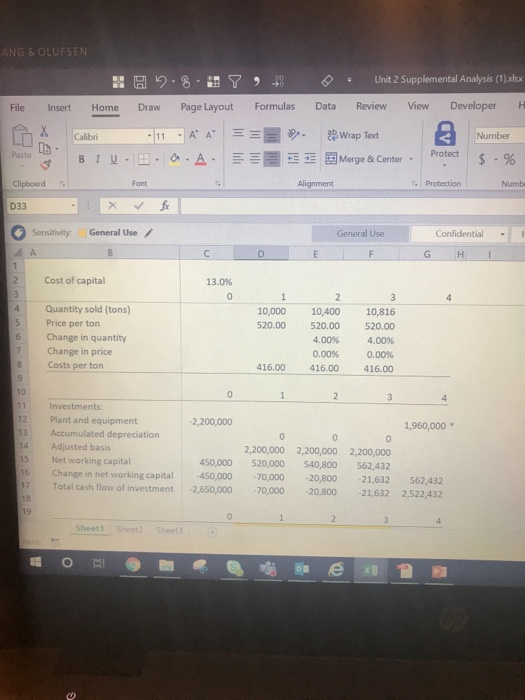
Please refer to the spreadsheet file (Unit 2 Supplemental Analysis.xls) for the analysis related to a hog feed project. United Feed is considering a proposal to produce hog feed. The hog feed project requires an investment in new plant and equipment of $2.20 million. This could be depreciated for tax purposes straight-line over 10 years to zero salvage value. However, the plant and equipment will be sold when the project is terminated for $1.8 million. The project will generate sales for 3 years and will be terminated at the end of year 4. Year 1 sales of hog feed are expected to be 10,000 tons at $520 per ton, and thereafter quantity is forecasted to grow by 4% a year while the price remains constant. Costs are expected to be $416 per ton. Profits are subject to tax at 40% and the cost of capital is 13%. The project requires the following amounts in working capital, $450,000, $520,000, $540,800, $562,432 in year 0 year 3, respectively and the accumulated level of working capital in year 3 will be recovered in year 4. Determine the values of yellow background cells in the spreadsheet file and decide if United Feed should invest in this project?
Cost of capital: 0.13
| 0 | 1 | 2 | 3 | 4 | |
| Quantity sold (tons) | 10,000 | 10,400 | 10,816 | ||
| Price per ton | 520 | 520 | 520 | ||
| Change in quantity | 4% | 4% | |||
| Change in price | |||||
| Costs per ton | 416 | 416 | 416 |
| Investment | 0 | 1 | 2 | 3 | 4 |
| Plant and equipment | -2,200,000 | 1,960,000 | |||
| Accumulated depreciation | |||||
| Adjusted basis | 2,200,000 | 2,200,000 | 2,200,000 | ||
| Net working capital | 450,000 | 520,000 | 540,800 | 562,432 | |
| Change in net working capital | -450,000 | -70,000 | -20,800 | -21,632 | 562,432 |
| Total cash flow of investment | -2,650,000 | -70,000 | -20,800 | -21,632 | 2,522,432 |
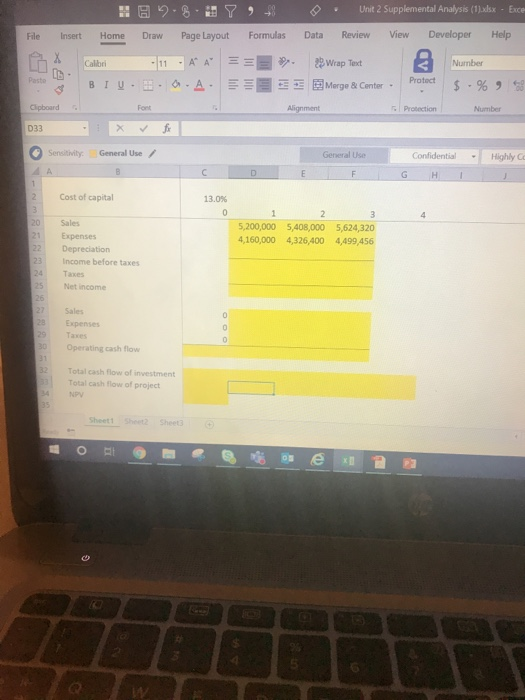
| To answer | 0 | 1 | 2 | 3 | 4 |
| Sales | |||||
| Expenses | |||||
| Depreciation | |||||
| Income before taxes | |||||
| Taxes | |||||
| Net income | |||||
| Sales | |||||
| Expenses | |||||
| Taxes | |||||
| Operating cash flow | |||||
| Total cash flow of investment | |||||
| Total cash flow of project | |||||
| NPV |

ANG & OLUFSEN File H H 2 Insert Home Draw Calibri 11 BIU. . Font 8 Y 38 Page Layout Formulas AA == . A. 3 0 Unit 2 Supplemental Analysis (1).xlsx Data Review View Developer H 2 Wrap Text 3 Number Merge & Conter - Protect $ - % . Posto L Alignment Protection Numb Clipboard D33 Sensitivity: General Use General Use Confidential - Cost of capital 13.0% 1 10,000 520.00 Quantity sold (tons) Price per ton Change in quantity Change in price Costs per ton 10,400 520.00 4.00% 0.00% 416.00 10,816 520.00 4.00% 0.00% 416.00 416.00 -2,200,000 1,960,000 Investments: Plant and equipment Accumulated depreciation Adjusted basis Net working capital Change in net working capital Total cash flow of investment 16 450,000 450,000 2,650,000 2,200,000 $20,000 70,000 - 70,000 2,200,000 540,800 20,800 20,800 2,200,000 562,432 21,632 21,632 562,432 2,522,432 18 19 Sheet1 Sheet Sheet ANG & OLUFSEN 0 Unit 2 Supplemental Analysis (1).xlsx Review View Developer H Data 2: 3 7 2. 8 File Insert Home Draw Page Layout Formulas -11-AASEE & BI U DA Clipboard Font X Colibri . Number - Wrap Test Merge & Conter Paste Protect $ . % Alignment Protection Numb Sensitivity: General Use General Use Confidential - Cost of capital 13.0% 10,000 520.00 Quantity sold (tons) Price per ton Change in quantity Change in price Costs per ton 10,400 520.00 4.00% 0.00% 416.00 10,816 520.00 4.00% 0.00% 416.00 416.00 -2,200,000 1,960,000 Investments: Plant and equipment Accumulated depreciation Adjusted basis Net working capital Change in net working capital Total cash flow of investment 16 450,000 450,000 2,650,000 2,200,000 520,000 70,000 70,000 2,200,000 540,800 20,800 20,800 0 2,200,000 562,432 21,632 21,632 562,432 2,522,432 19 Sheet1 Sheet Sheet3 B 2 Draw Y Page Layout ) Formulas H File Insert Home Calibri B IU. Clipboard - X Unit 2 Supplemental Analysis (1).xlsx - Exce Data Review View Developer Help Wrap Test 3 Nurnber Marge & Center - Protect $ - % 9 58 . - 11 -A A .0.A. == E Font Alignment Protection Number fx Sensitivity: General Use - Highly Co Confidential G H F I Cost of capital 13.0% 5,200,000 4,160,000 5,408,000 4,326,400 5,624,320 4,499,456 Sales Expenses Depreciation Income before taxes Taxes Net Income Sales Expenses Taxes Operating cash flow Total cash flow of investment Total cash flow of project NPV Sheetthet2 Sheet ANG & OLUFSEN File H H 2 Insert Home Draw Calibri 11 BIU. . Font 8 Y 38 Page Layout Formulas AA == . A. 3 0 Unit 2 Supplemental Analysis (1).xlsx Data Review View Developer H 2 Wrap Text 3 Number Merge & Conter - Protect $ - % . Posto L Alignment Protection Numb Clipboard D33 Sensitivity: General Use General Use Confidential - Cost of capital 13.0% 1 10,000 520.00 Quantity sold (tons) Price per ton Change in quantity Change in price Costs per ton 10,400 520.00 4.00% 0.00% 416.00 10,816 520.00 4.00% 0.00% 416.00 416.00 -2,200,000 1,960,000 Investments: Plant and equipment Accumulated depreciation Adjusted basis Net working capital Change in net working capital Total cash flow of investment 16 450,000 450,000 2,650,000 2,200,000 $20,000 70,000 - 70,000 2,200,000 540,800 20,800 20,800 2,200,000 562,432 21,632 21,632 562,432 2,522,432 18 19 Sheet1 Sheet Sheet ANG & OLUFSEN 0 Unit 2 Supplemental Analysis (1).xlsx Review View Developer H Data 2: 3 7 2. 8 File Insert Home Draw Page Layout Formulas -11-AASEE & BI U DA Clipboard Font X Colibri . Number - Wrap Test Merge & Conter Paste Protect $ . % Alignment Protection Numb Sensitivity: General Use General Use Confidential - Cost of capital 13.0% 10,000 520.00 Quantity sold (tons) Price per ton Change in quantity Change in price Costs per ton 10,400 520.00 4.00% 0.00% 416.00 10,816 520.00 4.00% 0.00% 416.00 416.00 -2,200,000 1,960,000 Investments: Plant and equipment Accumulated depreciation Adjusted basis Net working capital Change in net working capital Total cash flow of investment 16 450,000 450,000 2,650,000 2,200,000 520,000 70,000 70,000 2,200,000 540,800 20,800 20,800 0 2,200,000 562,432 21,632 21,632 562,432 2,522,432 19 Sheet1 Sheet Sheet3 B 2 Draw Y Page Layout ) Formulas H File Insert Home Calibri B IU. Clipboard - X Unit 2 Supplemental Analysis (1).xlsx - Exce Data Review View Developer Help Wrap Test 3 Nurnber Marge & Center - Protect $ - % 9 58 . - 11 -A A .0.A. == E Font Alignment Protection Number fx Sensitivity: General Use - Highly Co Confidential G H F I Cost of capital 13.0% 5,200,000 4,160,000 5,408,000 4,326,400 5,624,320 4,499,456 Sales Expenses Depreciation Income before taxes Taxes Net Income Sales Expenses Taxes Operating cash flow Total cash flow of investment Total cash flow of project NPV Sheetthet2 Sheet
Step by Step Solution
There are 3 Steps involved in it

Get step-by-step solutions from verified subject matter experts