

Question: Please remember to draw graphs for b and c separately! 1. (25 points). Suppose household preferences are described by the utility function 1 2 U(C,)
Please remember to draw graphs for b and c separately!
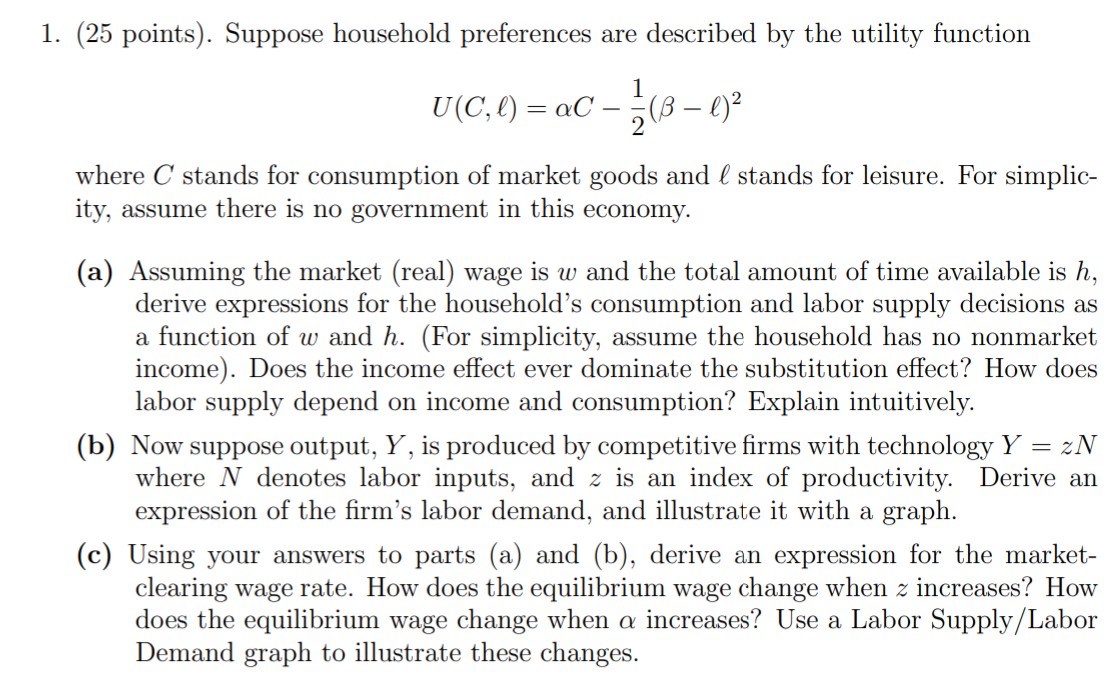
1. (25 points). Suppose household preferences are described by the utility function 1 2 U(C,) = a0 503 6') where C stands for consumption of market goods and 6 stands for leisure. For simplic- ity, assume there is no government in this economy. (a) Assuming the market (real) wage is w and the total amount of time available is h, derive expressions for the household's consumption and labor supply decisions as a function of w and h. (For simplicity, assume the household has no nonmarket income). Does the income effect ever dominate the substitution effect? How does labor supply depend on income and consumption? Explain intuitively. (b) Now suppose output, Y, is produced by competitive rms with technology Y = 2N where N denotes labor inputs, and z is an index of productivity. Derive an expression of the rm's labor demand, and illustrate it with a graph. (c) Using your answers to parts (a) and (b), derive an expression for the market clearing wage rate. How does the equilibrium wage change when 2 increases? How does the equilibrium wage change when 01 increases? Use a Labor Supply / Labor Demand graph to illustrate these changes
Step by Step Solution
There are 3 Steps involved in it

Get step-by-step solutions from verified subject matter experts