

Question: Please reply quickly and not handwritten Question 5: Following chart depicts stocks and flows relation of Dongguk Industry for the fiscal year 20182019 based on
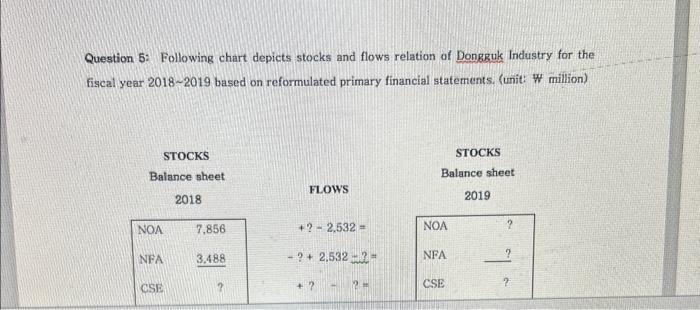
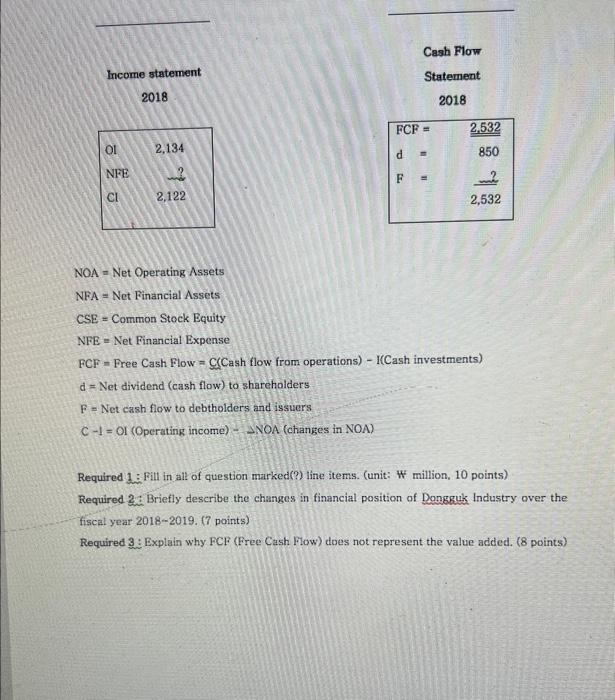
Question 5: Following chart depicts stocks and flows relation of Dongguk Industry for the fiscal year 20182019 based on reformulated primary financial statements. (unit: W million) Income statement Cash Flow 2018 Statement 2018 NOA = Net Operating Assets NFA = Net Financial Assets CSE= Common Stock Equity NFE= Net Financial Expense FCF= Free Cash Flow =C( Cash flow from operations )I (Cash investments) d= Net dividend (cash flow) to shareholders F= Net cash flow to debtholders and issuers C1=OI (Operating income) - DNOA (changes in NOA) Required 1. Fill in all of question marked(?) line items. (unit: w million, 10 points) Required 2a Briefly describe the changes in financial position of Dongguk Industry over the fiscal year 20182019. (7 points) Required 3: Explain why FCF (Free Cash Flow) does not represent the value added. (8 points)
Step by Step Solution
There are 3 Steps involved in it

Get step-by-step solutions from verified subject matter experts