

Question: Please review images provided for excel file. The Tottenham problem is a Discounted Cash Flow analysis, set up the FCF formula; and discount a series
Please review images provided for excel file.
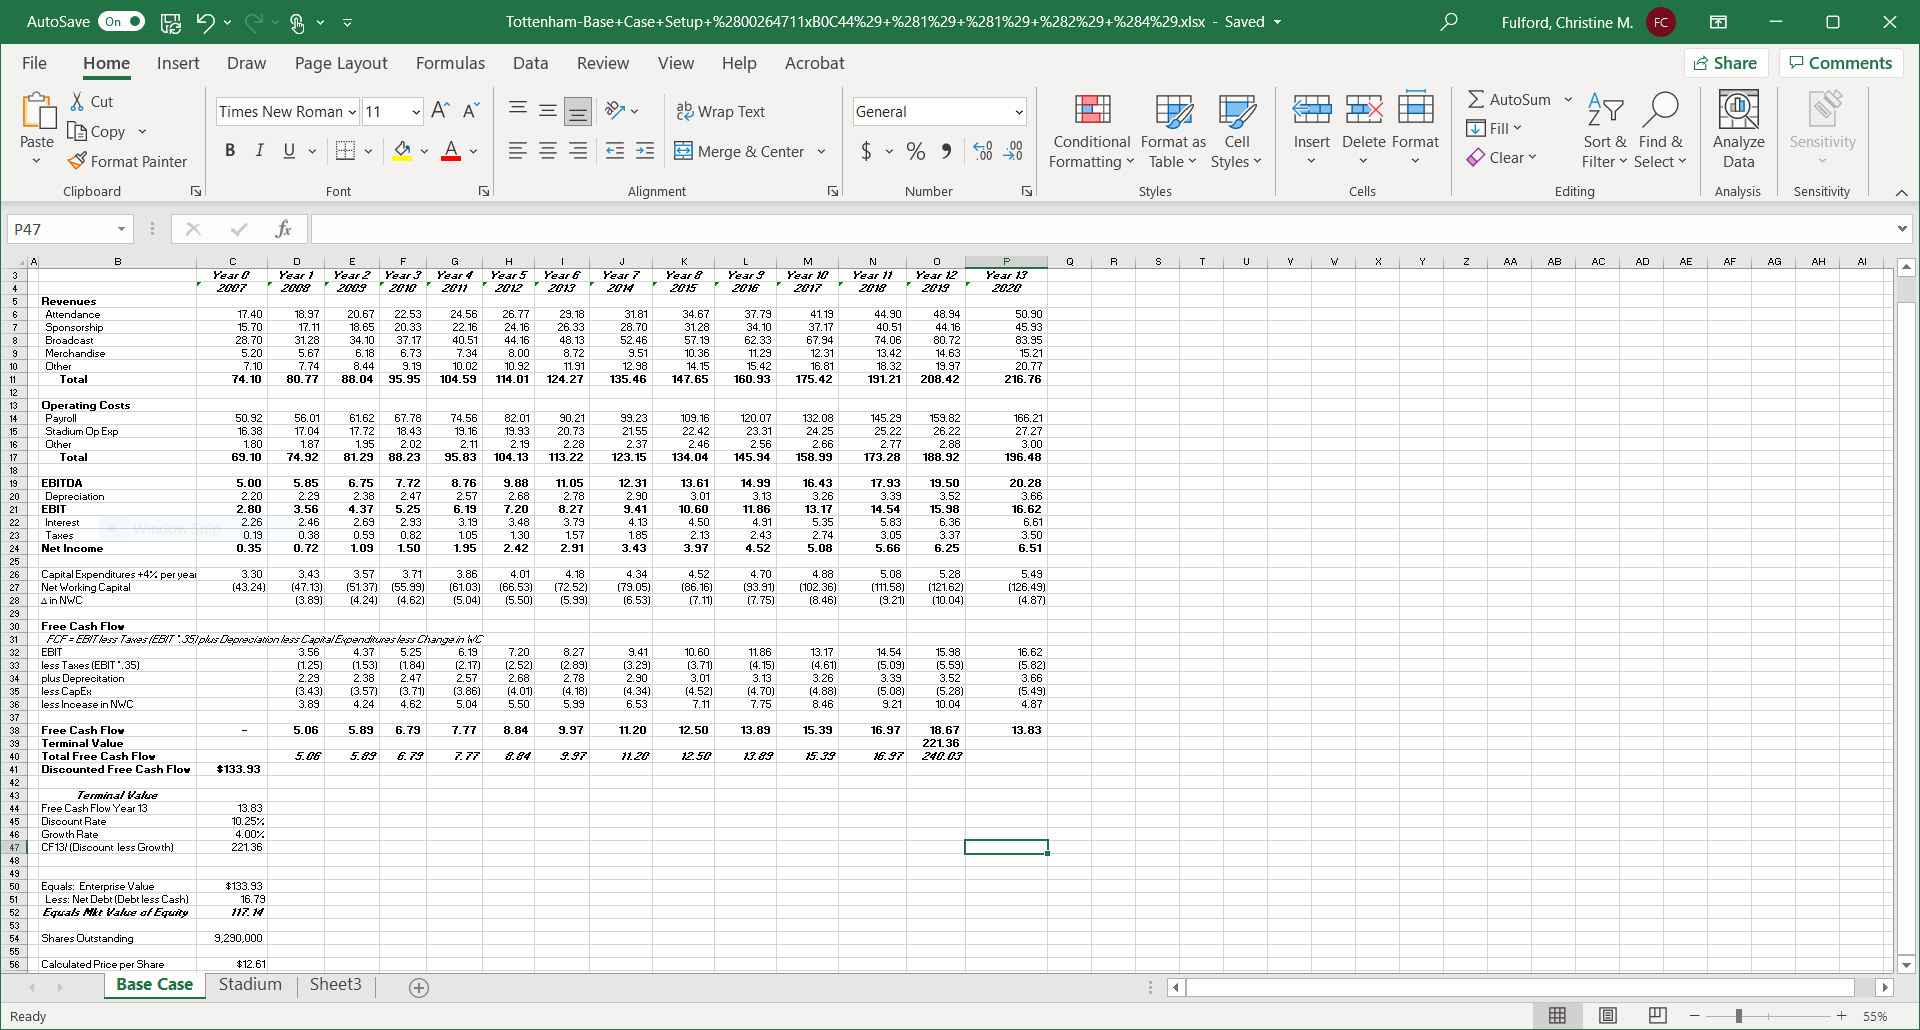
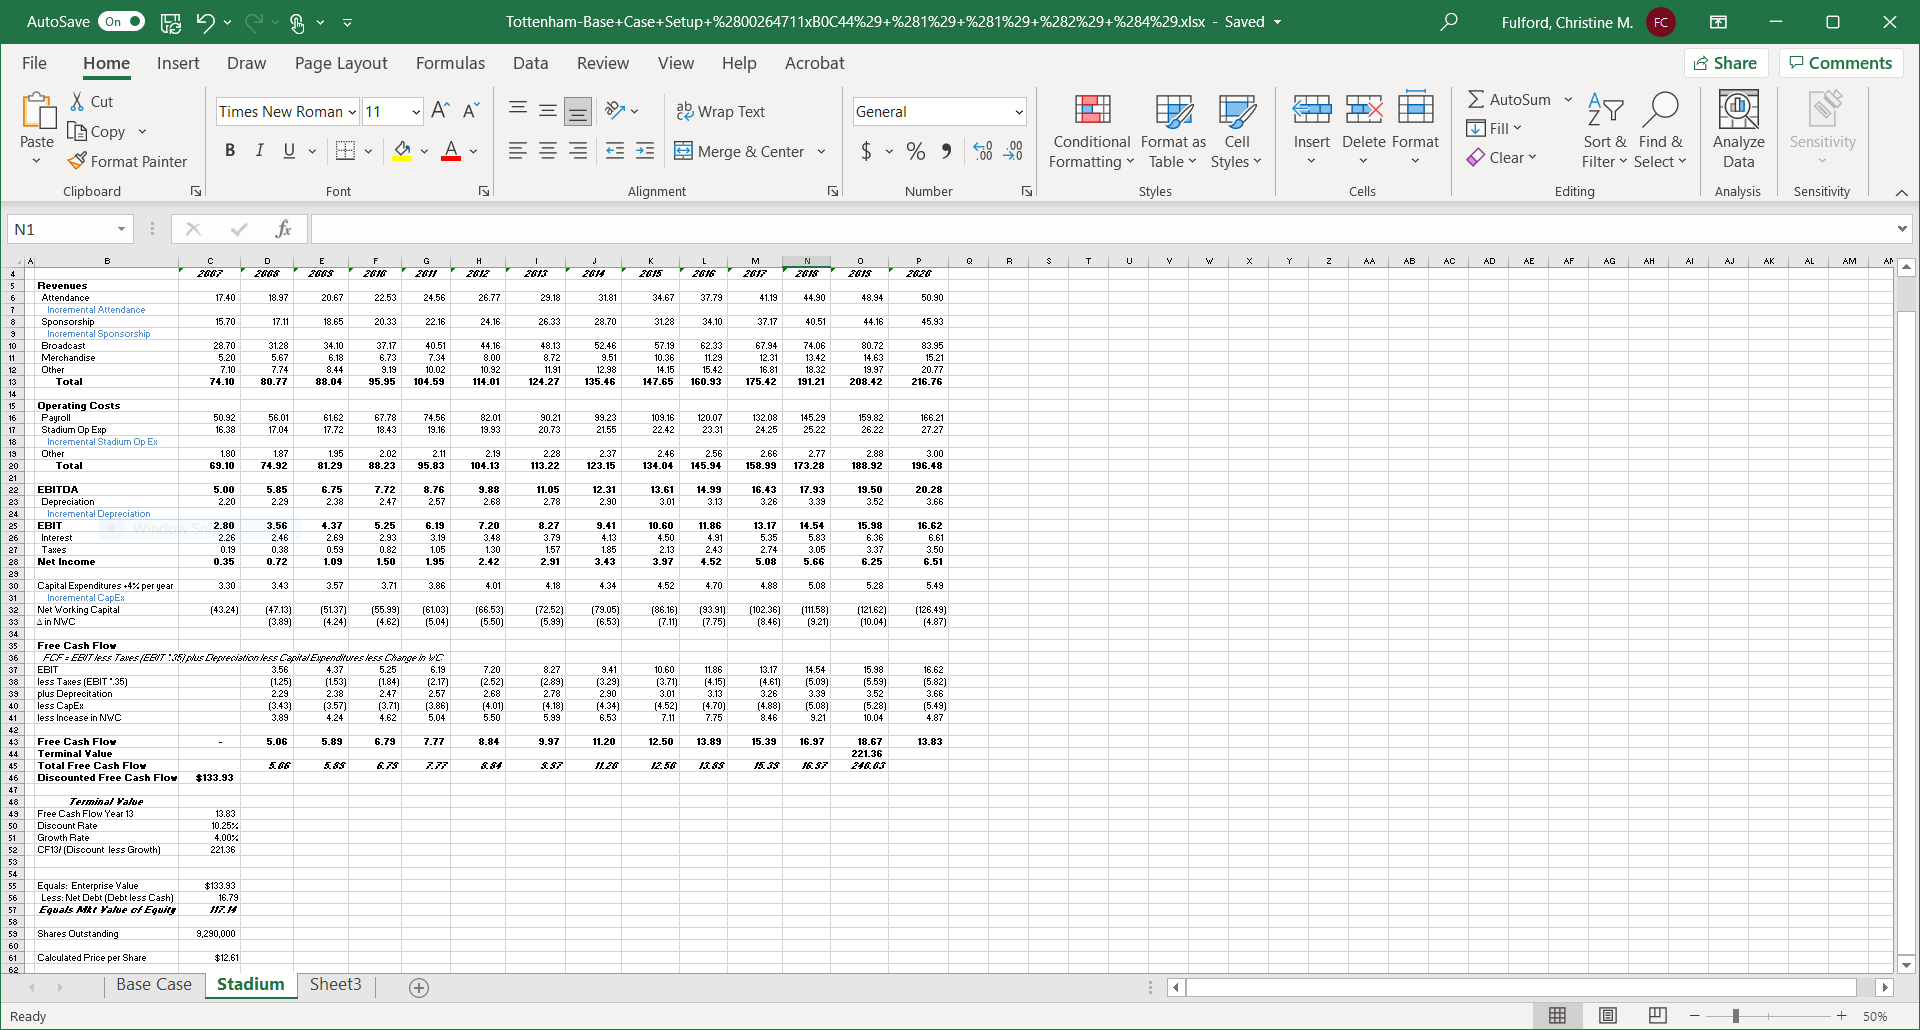
The Tottenham problem is a Discounted Cash Flow analysis, set up the FCF formula; and discount a series of cash flows.
What data do we need to conduct DCF analysis? For the base case set up, we need:
AutoSave On . Tottenham-Base+Case+Setup+%2800264711xBOC44%29+%281%29+%281%29+%282%29+%284%29.xlsx - Saved LO Fulford, Christine M. FC O X File Home Insert Draw Page Layout Formulas Data Review View Help Acrobat 15 Share Comments X Cut Times New Roman ~ 11 " A" A ap Wrap Text General _ AutoSum ~ AY O Paste [ Copy Fill Conditional Format as Cell Insert Delete Format Sort & Find & Analyze Sensitivity Format Painter BIU DAY EE Z E Merge & Center v $ ~ % 9 08 20 Formatting " Table Styles Clear Filter ~ Select Data Clipboard Font Alignment Number Styles Cells Editing Analysis Sensitivity P47 X V B C D G H M Q R S T w X Y 2 AA AB AC AD AE AF AG AH Al Year Year 1 Year 2 Year 3 Year 4 Year 5 Year 6 Year 7 Year S Year 9 Year 10 Year 11 Year 12 Pear 13 2067 2609 26 16 2617 2012 2013 2014 2015 2016 2017 2015 2019 Revenues Attendance 17.40 18.3 20.5 22.53 24.56 26.77 31.8 34.67 37.73 1. 19 44.30 48.94 50.90 Sponsorship 15.70 17.11 18.65 20.3 22.16 24.18 26.33 8. 70 31.28 34. 10 37.17 40.51 44 16 45.93 8 Broadcast 8.70 31.28 34. 10 37.17 40.51 44. 16 18 13 52.46 57.19 62.33 7.94 4.06 10.72 33.95 Merchandise 5.20 567 6.18 6.73 7.34 8.00 8.72 951 10.36 11.29 12 31 13.42 14.63 15.21 Other 7.10 7.74 8.44 9.19 10.02 10.92 11.91 12.98 14.15 15.42 16.81 18.32 19.97 20.77 Total 14.10 30.77 88.04 95.95 104.59 114.01 124.27 135.46 147.65 160.93 175.42 191.21 208.42 216 76 Operating Costs Payroll 0.9 56.0 61.62 67.78 4.50 62.01 33.25 19. 16 120.07 132.08 145.25 159.8 166.21 Stadium Op Exp 6.38 17.04 17 72 18.43 19. 16 19.93 20.73 21.55 22.42 23.31 24.25 25.22 26.22 27.27 Other 1.80 1.87 195 2 02 2 11 2.19 2.28 2.37 2.46 2.56 7 66 2.77 2.88 3.00 Total 69. 10 74.92 81.29 88.23 95.83 104. 13 113.22 123.15 134.04 145.94 158.99 173.28 188.92 196.48 EBITDA 5.00 5.85 6.75 . 12 3. 16 9.88 11.05 12 31 13.61 14.99 16.43 17.93 19.50 20.28 Depreciation 2.20 2.29 2.38 2.47 2.57 2.68 2.78 2.90 3.0 3.13 326 3.39 352 3.66 21 EBIT 2.80 3.56 4.37 5.25 6.19 7.20 B.27 3.41 0. 60 1.86 13.17 4.54 5.98 6.62 22 Interes 2.26 2 46 2.63 2.93 3 19 3.48 3.79 4.13 4.50 4.91 5.35 5.83 6.36 6.61 23 Taxes 0.19 0.38 059 0.82 1.05 1.30 1.57 1.85 2.13 2.43 2.74 3.05 3.37 3.50 24 Net Income 0.35 0.72 1.09 1.50 1.95 2.42 2.91 3.43 3.97 4.52 5 08 5.66 3.25 6.51 25 26 Capital Expenditures +4%% per year 3.30 3.43 3.57 3.71 3.86 4.01 4.18 4.3 4.52 4.70 4.86 5.08 5.28 5.49 27 Net Working Capital 3.24) (47.13) (51.37) 155.99 (61.03) 36.53) 72.52) (79.05) 36.16 93.9 102.36 111.58) 121.62 126.49) 28 in NWC (3.89) (4.24) 14 62 (5.04) (5.50) (5.99) (6.53) (7.11) (7.75) (8.46) (9.21) (10.04 (4.87 29 30 Free Cash Flow FCF = EBIT lass Tawes (EBIT * 35/ pis Depreciation less Capital Expenditures less Change in WC 32 EBIT 3.56 4.37 5.25 6. 19 1.20 8.27 9.41 10.60 11.86 13.17 14.54 5.98 6.62 33 less Taxes (EBIT '.35) (1.25) (1.53) (1.84) (2. 17) (2.52) (2.89) 3.29 (3.71) (4.15 (4.61) (5.09) 15.59 (5.82) 34 plus Deprecitation 2.29 2.38 2.47 2.57 2.68 2.78 2.90 3.01 3.13 3.26 3.39 3.52 3.66 less CapEx (3.43) (3.57) (3.71) 3.86) (4.01 (4. 18) (4.34) (4.52) 4.70) (4.88 (5.08) 15 28 (5.49) 36 less Incease in NWC 3 89 4.24 4.62 5 04 5.50 5,99 7.11 7 75 8.46 9.21 10.04 4.87 37 38 Free Cash Flow 5.06 5.89 6.79 7.77 8.84 9.97 11.20 12.50 13.89 15.39 16.97 18.67 13.83 39 Terminal Value 221.36 40 Total Free Cash Flow 5. 06 5. 89 6. 79 7. 77 8.34 9. 97 11. 20 12.50 13.85 15. 35 16. 97 240.63 41 Discounted Free Cash Flow $133.93 42 43 Terminal Value Free Cash Flow Year 13 13.83 45 Discount Rate 10.25%% 46 Growth Rate 4.00% 47 CF 13/ (Discount less Growth) 221.36 48 49 50 Equals: Enterprise Value $133.93 51 Less: Net Debt (Debt less Cash] 16. 79 52 Equals Mkt Value of Equity 117. 14 53 54 Shares Outstanding 9,290,000 55 Calculated Price per Share $12.61 Base Case Stadium Sheet3 + Ready O J --1 + 55%FC X LO Fulford, Christine M. O Tottenham-Base+Case+Setup+%2800264711xBOC44%29+%281%29+%281%29+%282%29+%284%29.xlsx - Saved AutoSave On . 15 Share Comments Data Review View Help Acrobat File Home Insert Draw Page Layout Formulas _ AutoSum AY O General X Cut Fill Times New Roman ~ 11 A" A " ap Wrap Text Insert Delete Format Sort & Find & Analyze Sensitivity Conditional Format as Cell $ ~ % 9 08 20 Clear Filter ~ Select Data [ Copy Paste BIU DAY EE Z E Merge & Center v Formatting Table Styles Analysis Sensitivity Format Painter Editing Styles Cells Alignment Number Clipboard Font X Y AK AL AM N1 s T U W x 2 AA AB AC AD ME AF AG AH AI Ad K M N 0 Q R C G 2815 B D 2615 2626 2667 2691 2612 2613 2614 2616 48.94 50.90 Revenues 24.56 26.77 29.18 31.8 34.67 37.79 41.19 44.90 17.40 18.9 22.5 Attendance 20.67 34.10 37 17 40.51 44.16 45.93 Incremental Attendance 31.28 15.70 17.11 18.65 20.33 22.16 24.16 26.33 28.70 Sponsorship 83.95 Incremental Sponsorship 67.94 48.13 07.19 80.12 31.28 37.17 40.51 44.16 52.46 62.35 10.36 11.29 12.31 13.42 14.63 15.21 Broadcast 28.10 $4.10 8.72 95 6 20 5.67 6.18 6.73 7.3 8.00 14 15 Merchandise 10.92 11.91 12 98 15.42 20.77 16.81 18 32 19 97 10 02 7 10 8.44 9.19 47.65 160 93 175.42 91.21 208.42 216.76 Other 74.10 80.77 38.04 35.95 104.59 114.01 124.27 135.46 Total 32.08 145.2 bb.2 Operating Costs 90.2 99.2 109.16 20.0 9.8 82.0 25.22 26 22 27 37 Payroll 50.92 56.01 61.62 19.93 20.73 23.31 24.25 Stadium Op Exp 16.38 17 04 3 72 18.43 Incremental Stadium Op Ex 2.66 2.2 2.37 2.56 2.7 2.88 3.00 2.46 1.80 1.8 1.95 2.02 2.19 13 22 23.15 134.04 145.94 58.99 173.28 188.92 96.48 Jther 81 29 $8 23 95 83 104 13 20 Total 69.10 4.92 19.50 20.28 8.76 9.8% 11.0 2.31 13.61 14.95 16.43 17.93 5.00 5.82 6.75 .72 2 90 301 3.1 32 3.3 3.52 3.6 EBITDA 2.6 27 2.20 2.29 2.38 247 Depreciation 16.62 Incremental Depreciation 9.41 0.b 1.86 3.17 4.54 15.9 .37 .20 .21 CZ." 150 4.91 6.35 5.83 6.36 6.61 EBIT 2.80 $.56 2.26 2.46 2.69 293 3.48 3.79 4.15 3.37 3.50 Interest 105 130 157 2.13 2.74 3.05 6.51 Taxes 0.19 0.38 0.59 0 82 25 0 72 109 50 195 42 2.91 3.43 .97 152 5.66 Net Income 0.35 6.0 5.49 4.70 1.81 5.28 4.5 3.43 3.57 3.7 381 4.01 4.18 4.34 Capital Expenditures +4%% per year 3.30 (86.16] (102.36] (111.58) 121.62 (126.49) Incremental CapEx (79.05) (93.91) Net Working Capital (43.24) (47.13) (51.37) 155.99 (61.03 66.53] 72.52] (9.21) 10.04 (4.87] (3.89) (4.24) (4.62] (5.04) (5.50) (5.99) (6.53) (7.11) (7.75 (8.46] A in NWC 92828898 Free Cash Flow FCF = ERIT less Taves (EDIT :35) plus Depreciation less Capital Expenddues less Change in VC. 11.86 13.17 14.54 15.98 16.62 3.56 4.37 6.25 6.19 7.20 8.27 9.41 10.60 3.29) (3.71 (4.15 (4.61) (5.09 (5.59) (5.82 EBIT (1.84) (2.17] (2.89) less Taxes [EBIT ' 35) (1.25 (1.53) (2.52 2.78 `2 90 3.01 3.13 3.26 3 39 352 3.66 2.29 2.38 2.47 257 2.68 4.52] 4.70) (4.88) (5.08) (5.28 (5.49) 39 plus Deprecitation (3.43 (3.57) 3.71) (3.86 (4.01 (4.18) (4.34) 7.11 8.46 6 21 10 04 40 less CapER 6 53 3 89 4 24 5 04 5.99 less Incease in NWC 9.97 11.20 12.5 13.89 15.39 16.97 18.67 13.83 Free Cash Flow 5.06 5.89 6.79 7.77 8.84 221.36 $.$7 11.26 12.50 13.85 15.35 16. $7 Terminal Value Total Free Cash Flow 5. 06 7.77 Discounted Free Cash Flow $133.93 Terminal Value Free Cash Flow Year 13 13.83 Discount Rate 10.25% Growth Rate 4.00% CF13/ (Discount less Growth] 221.36 Equals: Enterprise Value :133.9 Less: Net Debt [Debt less Cash] 16.79 Equals Mit Value of Equity Shares Outstanding 9,290,000 61 Calculated Price per Share $12.61 Sheet3 + 50% Base Case Stadium + Ready\f
Step by Step Solution
There are 3 Steps involved in it

Get step-by-step solutions from verified subject matter experts