Question: Please review the data below then answer these questions: Required: Review the key ratios and provide a summary of your analysis for the following questions:
Please review the data below then answer these questions:
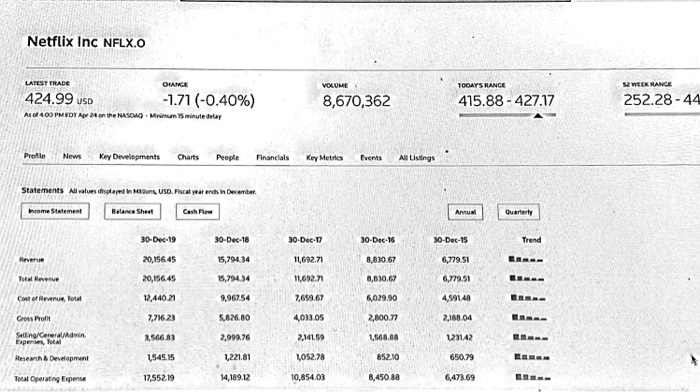
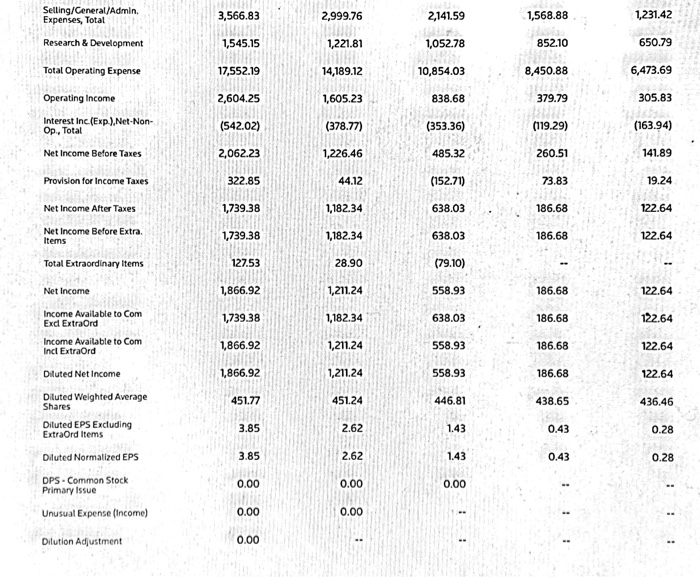
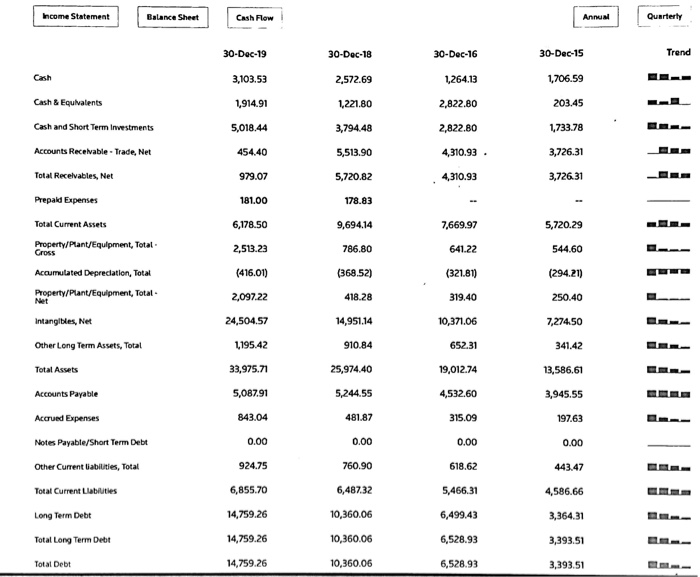
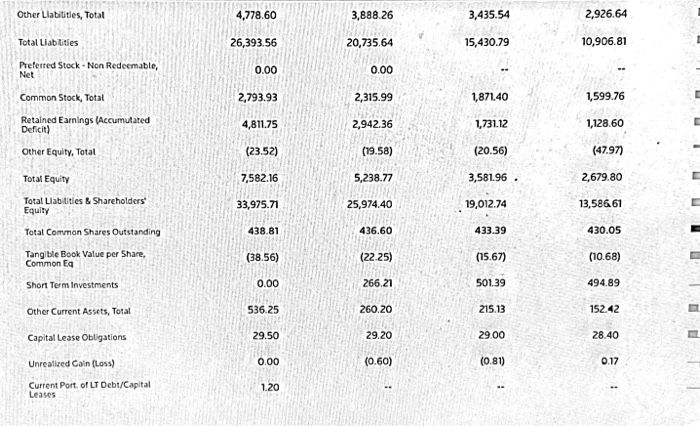
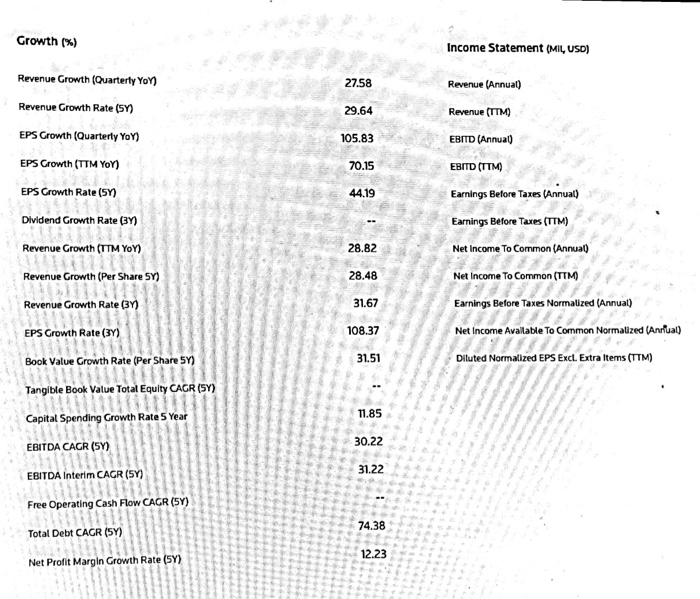
Required: Review the key ratios and provide a summary of your analysis for the following questions:
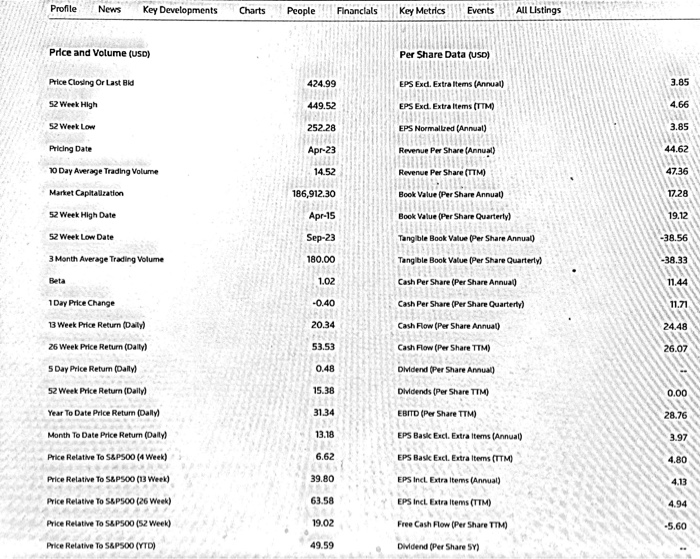
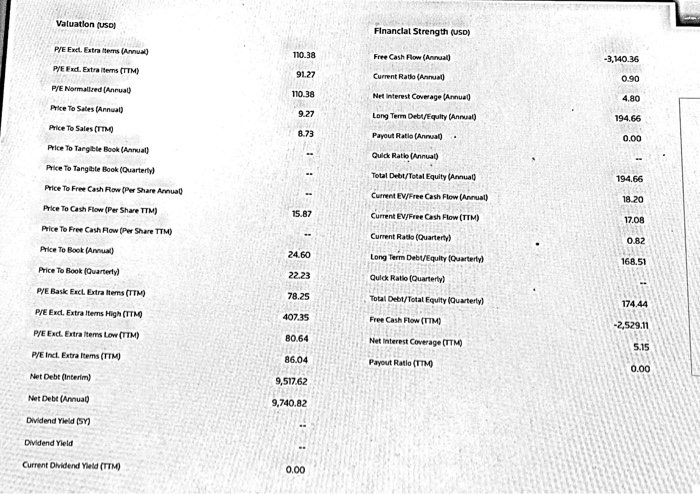
1. Is the company showing good liquidity?
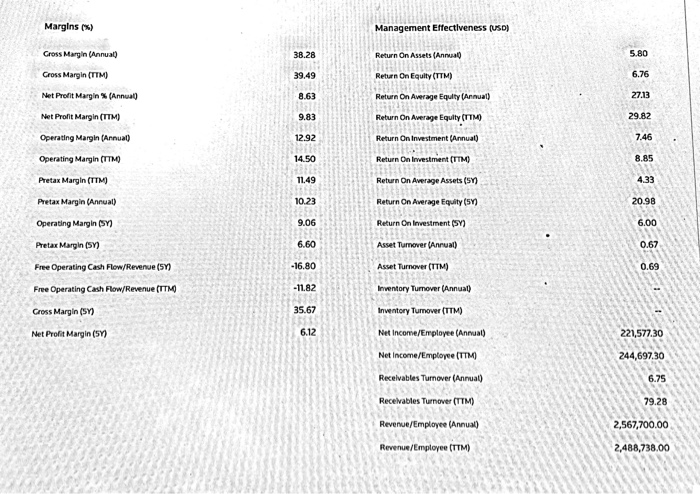
2. How is their profitability?
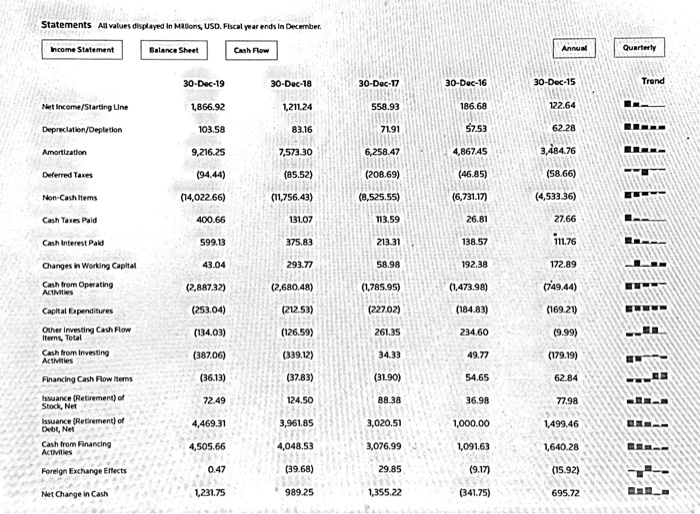
3. Are they managing cash and receivables properly?
4. How effectively are they using their assets?
5. Are they in a good leveraged position with debt/equity?
Netflix Inc NFLX.O VOLUME TOCATS RANGE LATEST TRADE DIANCE 424.99 USD As of 409 PMIDT Apon the NASEWO Minum minute delay -1.71 (-0.40%) 8,670,362 415.88 - 427.17 SWEEX RANGE 252.28 -44 Profile News Key Developments Charts People Financials Key Metries Events All Listings Statements All values Income Statement and in Millions USD. Focal your ends in December Balance Sheet Cash Flow 30-Dec-19 30-Dec-18 30-Dec-17 30-Dec-16 30-Dec-15 20,156.45 15,794 34 11,692.71 8.830.67 6,779.51 20,156.45 15,794.34 11,692.71 8,610.6 6.779.51 Cost of Revenue Total 12,440 21 196754 7,699.67 6,029.90 4 1148 Cross Pront 7,716.23 5,826.80 4,033.05 2,800.77 2,188.04 Suing/Generaldwin 2,566.83 2,999.76 2,141.5 1,568.88 1231A2 Research & Development 1545.15 1221.81 L052.78 852.10 650.79 Total Operating Expense 17,552.19 14,189.12 10,854.03 8.450 88 6,473.69 Selling/General/Admin. Expenses, Total 3,566.83 2,999.76 2,141.59 1,568.88 1,231.42 Research & Development 1,545.15 1,221.81 1,052.78 852.10 650.79 Total Operating Expense 17,552.19 14,189.12 10,854.03 8,450.88 6,473.69 Operating Income 2,604.25 1,605.23 838.68 379.79 305.83 Interest Inc (Exp.) Net-Non- Op., Total (542.02) (378.77) (353.36) (119.29) (163.94) Net Income Before Taxes 2,062.23 1,226.46 485.32 260.51 141.89 Provision for Income Taxes 322.85 44.12 (152.71) 73.83 19.24 Net Income After Taxes 1,739.38 1,182.34 638.03 186.68 122.64 Net Income Before Extra. Items 1,739,38 1,182.34 638.03 186.68 122.64 Total Extraordinary items 127.53 28.90 (79.10) 558.93 Net Income 1,866.92 1,211.24 186.68 122.64 Income Available to Com Exd Extraord 1,739.38 1,182.34 638.03 186.68 122.64 Income Available to com Incl Extraord 1,866.92 1,211.24 558.93 186.68 122.64 Diluted Net Income 1,866.92 1,211.24 558.93 186.68 122.64 Diluted Weighted Average Shares 451.77 451.24 446.81 438.65 436.46 Diluted EPS Excluding Extraord Items 3.85 2.62 1.43 0.43 0.28 Dituted Normalized EPS 3.85 2.62 0.43 0.28 DPS. Common Stock Primary Issue 0.00 0.00 0.00 Unusual Expense (Income) 0.00 0.00 Dilution Adjustment 0.00 Income Statement Balance Sheet Cash Flow Annual Quarterly 30-Dec-19 30-Dec-18 30-Dec-16 30-Dec-15 Trend Cash 3,103.53 1,264.13 2,572.69 1,221.80 1,706.59 203.45 Cash & Equivalents 2,822.80 1,914.91 5,018.44 Cash and Short Term Investments 3,794.48 2,822.80 1,733.78 Accounts Receivable - Trade, Net 454.40 5,513.90 4,310.93 3,726.31 LLLL Total Receivables, Net 979.07 5,720.82 4310.93 3,726.31 Prepaid Expenses 181.00 178.83 Total Current Assets 6,178.50 9,694.14 7,669.97 5,720.29 Property/Plant/Equipment, Total Cross 2,513.23 786.80 641.22 544.60 (416.01) (368.52) (321.81) (294.21) Accumulated Depreciation, Total Property/Plant/Equipment, Total 2,097.22 418.28 319.40 250.40 Intangibles, Net 24,504.57 14,951.14 10,371.06 7,27450 Other Long Term Assets, Total 1,195.42 910.84 652.31 341.42 Total Assets 19,012.74 13,586.61 33,975.71 5,087.91 25,974.40 5,244.55 LLLL Accounts Payable 4,532.60 3,945.55 Accrued Expenses 843.04 481.87 315.09 197.63 Notes Payable/Short Term Debt 0.00 0.00 0.00 0.00 Other Current abilities, Total 924.75 760.90 618.62 443.47 Total Current Llabilities 6,855.70 6,487.32 5,466.31 4,586.66 Long Term Debt 14,759.26 10,360.06 6,499.43 3,364.31 Total Long Term Debt 14,759.26 10,360.06 6,528.93 3,393.51 Total Debt 14,759.26 10,360.06 6,528.93 3,393.51 Other Llabilities, Total 4,778.60 3,888.26 3,435,54 2,926.64 Total Liabilities 26,393.56 20,735.64 15,430.79 10,906.81 Preferred Stock - Non Redeemable, 0.00 0.00 Common Stock, Total 2,793.93 2,315.99 1,871.40 1,599.76 Retained Earnings (Accumulated Deficit) 4,811.75 2,942.36 1,731.12 1,128.60 Other Equity, Total (23.52) (19.58) (20.56) (47.97) 7,582.16 5,238.77 3,581.96 2,679.80 Total Equity Total Liabilities & Shareholders Equity 33,975.71 25,974.40 19,012.74 13,586.61 Total Common Shares Outstanding 438.81 436.60 433.39 430.05 Tangible Book Value per Share, Common Eq (38.56) (22.25) (15.67) (10.68) Short Term Investments 0.00 266.21 501.39 494.89 Other Current Assets, Total 215.13 536.25 29.50 260.20 29.20 152.42 28.40 Capital Lease Obligations 29.00 Unrealized Cain (Loss) (0.60) (0.81) 0.17 0.00 1.20 Current Port of LT Debt/Capital Leuses Statements All values displayed in Millions USD. Fiscal year ends in December Income Statement Balance Sheet Cash Flow 30-Dec-19 30-Dec-18 30-Dec-17 30-Dec-16 30-Dec-15 Net Income/Starting Une 1,866.92 L211.24 554.93 186.68 122.64 Depreciation/Oepletion 103.58 83.16 71.91 57.53 62.28 Amortization 9,216.25 7,573.30 6,258.47 4.86745 3,484.76 Deferred Taxes (94.44) (85.52) (208.69) (46.85) (58.66) Non-Cash Items (14,022.66) (11756.43) (8,525.55) (6.731.17) (4,533.36) Cash Taxes Pald 400.66 131.07 113.59 26.81 27.66 Cash Interest Pald 599.13 375.83 21331 138.57 111.76 Changes in Working Capital 43.04 293.77 58.98 192.38 172.89 Cash from Operating Activities (2,887.32) (2,680.48) (1,785.95) (1.473.98) (749.44) Capital Expenditures (253.04) (212.53) (227.02) (184.83) (169.21) (134.03) (126.59) 261.35 234.60 (9.99) Other investing Cash Flow Itens, Total Cash from investing Activities (387.06) (339.12) 49.77 (179.19) 62.84 Financing Cash Flow Items (36.13) (37.83) (31.90) 54.65 Issuance (Retirement of Stock, Net 72.49 124.50 88.38 36.98 77.98 4,469.31 3,961.85 3,020.51 1,000.00 1,499.46 Issuance (Retirement of Debt, Net Cash from Financing Activities 4,505.66 4,048.53 3,076.99 1,091.63 1.640.28 Foreign Exchange Effects 0.47 (39.68) 29.85 (9.17) (15.92) Net Change in Cash 1,231.75 989.25 1,355.22 (341.75) 695.72 Profile News Key Developments Charts People Financials Key Metrics Events All Listings Price and Volume (USD) Per Share Data (USD) Price Closing Or Last Bld 424.99 EPS Exd, Fatra Items Anal) 3.85 4.66 52 Week High 449.52 EPS Exd. Extra Items (TTM 52 Week Low 252.28 EPS Normale Annual) 3.85 Pricing Date Apr-23 Revenue Per Share Annual 44 62 10 Day Average Trading Volume 14.52 Revenue Per Share (TTM) 47.36 Martiet Capitalization 186,91230 Book Value Per Share Annual 17.28 Week High Date Apr-15 Book Value Per Share Quarterly) 19.12 Week Low Date Sep-23 Tangible Book Value Per Share Annual) -38.56 3 Month Average Trading Volume 180.00 Tangible Book Value (Per Share Quarterly -38.33 Beta Cash Per Share (Per Share Annual) 11.44 1 Day Price Change Cash Per Share Per Share Quarterty) 11.71 1 Week Price Return (Daily Cash Flow (Pw Share Annual) 24.48 26 Week Price Return (Daily) Cash Flow Per Share TTM) 26.07 Day Price Return Daily Didend Per Share Anual S2 Week Price Return (D ) Dividends Per Share TTM 0.00 Year To Date Price Return (Dally EBITD (Per Share TTM) 28.76 Month To Date Price Return (Daily EPS Bask Excl. Extraiters (Annual) 97 Price Relative To S&P500 (4 Week) EPS Bask Esc. Extraterns (TTM) 4.80 Price Relative To S&P500 (13 Week) 39.80 EPS Incl Extra items (Annual) 4.13 Price Relative To S&P500 (26 Week) 63.58 EPS Incl Extra items (TTM) 4.94 Price Relative To S&P500 (52 Week) 19.02 Free Cash Flow (Per Share TM -5.60 Price Relative To 5&P500 (YTD) 49.59 Didend per Shares Valuation (USC) Financial Strength (USD) P/E Ext. Extraters (A ) Free Cash Flow (Annual 110.38 91.27 -3,140.36 0.90 PYE Fx. Etrans(TTM) Current Ratio Anna P/E Normative (Annus 4.80 Net interest Coverage (Annual Long Term Debt/Equity Annual Price To Sates (Annual 194.66 Price To Sales Payout Rate (An 0.00 Price To Targhe Book (Annual) Quick Ratio (Annual Total Dete/Total Equity 194.66 Price To Tangle Book (Ouarter Price To Free Cash Row Per Share Annual Current EV/Free Cash Flow (Annual) 18.20 Price To Cash Flow Per Share TTM) Current Ev/Free Cash Flow (TTM) 17.08 Price To Free Cash Flow Per Share TTM Current Ratio (Quarterty 0.82 Price To Book (Anna) 24.60 Long Term Debt/Equity Quarterly 168.51 Price To Book Quarterty 22 23 Quick Ratio Quarterly PYE Bask Excl btrallers (TTM) 78.25 Total Debt/Total Equity Quarterly) 174.44 P/E Exd. Extraiter High (TTM 407.35 Free Cash Flow (TIMO 2.529.11 P/E Exc. Extra Items Low (TTM) 80.64 Net interest Coverage (TTM 5.15 PE Inc. Extra item (TTM) 86.04 Payout Rate (UTM 0.00 Net Debt (interim) 9,517.62 Net Debt Annual 9,740.82 Dividend Yield on Dividend Yield Current Dividend Yield (TTMA Margins (%) Management Effectiveness (USD) Gross Margin (Annual) Return On Assets (Annual Gross Margin(TTM) 39.49 Return On Equity (TTM) en Net Profit Margin (Annual Return On Average Equity (Annual) 27.13 29.82 Net Profit Margin (TTM) Return On Average Equity (TTM) Operating Margin (Annual) Return On Investment (Annual) 7.46 Operating Margin(TTMO Return On Investment (TTM) 8.85 Pretax Margin (TTM) Return On Average Assets (SY) 4.33 Pretax Margin (Annual) Return On Average Equity (59) Operating Margin (5) Return On Investment (5) 20.98 6.00 0.67 Pretax Margin (5) Asset Turnover (Annual) Free Operating Cash Flow/Revenue (57) Asset Turnover (TTM) Free Operating Cash Flow/Revenue (TTM Inventory Turnover (Annual) Gross Margin (5) Inventory Turnover (TTM) Net Profit Margin (57) Net Income/Employee (Annual) 221,577.30 Net Income/Employee (TTM) 244,697.30 Receivables Turnover (Annual) 6.75 Receivables Turnover (TTM) 79.28 Revenue/Employee (Annual) 2,567,700.00 2,488,738,00 Revenue/Employee (TTM) Growth (%) Income Statement (MIL USD) Revenue Growth (Quarterly Yon 27.58 Revenue (Annual) Revenue Growth Rate (57) 29.64 Revenue (TTM) EPS Growth (Quarterly YoY) 105.83 EBITD (Annual) EPS Growth (TTM YoY) 70.15 EBITD (TIM) EPS Growth Rate (57) 44.19 Earnings Before Taxes (Annual) Dividend Growth Rate (3) Earnings Before Taxes (TTM) Revenue Growth (TTM YOY) Revenue crown the games (TTM Yon 28.82 Net Income To Common Annual not become to commentaa Revenue Growth (Per Share 5Y) 28.48 Revenue Growth Rate (37) 31.67 Earnings Before Taxes Normalized (Annual) EPS Growth Rate (3) 108.37 Net Income Avallable To Common Normalized (Anriual) Book Value Growth Rate (Per Share 59) 31.51 Diluted Normalized EPS Excl. Extra Iterns (TTM) Tangible Book Value Total Equity CAGR (5Y) Capital Spending Growth Rate 5 Year 11.85 30.22 EBITDA CAGR (SY) 31.22 EBITDA Interim CAGR (57) Free Operating Cash Flow CAGR (5Y) 74.38 Total Debt CAGR (5) Net Profit Margin Growth Rate


