

Question: Please scroll the bottom bar from left to right for the whole excel table Year Beer Cooler Demand Alternatives 2009 19059 Buy Process 1 Process
 Please scroll the bottom bar from left to right for the whole excel table
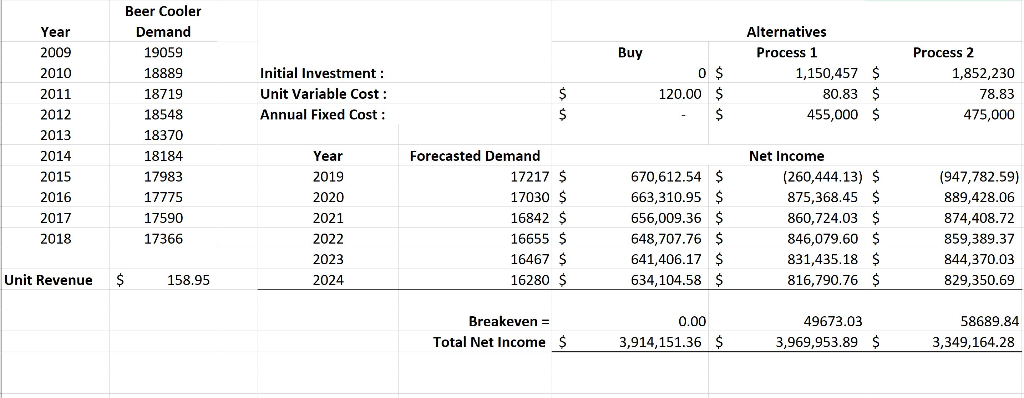
| Year | Beer Cooler Demand | Alternatives | |||||
| 2009 | 19059 | Buy | Process 1 | Process 2 | |||
| 2010 | 18889 | Initial Investment : | 0 | $ 1,150,457 | $ 1,852,230 | ||
| 2011 | 18719 | Unit Variable Cost : | $ 120.00 | $ 80.83 | $ 78.83 | ||
| 2012 | 18548 | Annual Fixed Cost : | $ - | $ 455,000 | $ 475,000 | ||
| 2013 | 18370 | ||||||
| 2014 | 18184 | Year | Forecasted Demand | Net Income | |||
| 2015 | 17983 | 2019 | 17217 | $ 670,612.54 | $ (260,444.13) | $ (947,782.59) | |
| 2016 | 17775 | 2020 | 17030 | $ 663,310.95 | $ 875,368.45 | $ 889,428.06 | |
| 2017 | 17590 | 2021 | 16842 | $ 656,009.36 | $ 860,724.03 | $ 874,408.72 | |
| 2018 | 17366 | 2022 | 16655 | $ 648,707.76 | $ 846,079.60 | $ 859,389.37 | |
| 2023 | 16467 | $ 641,406.17 | $ 831,435.18 | $ 844,370.03 | |||
| Unit Revenue | $ 158.95 | 2024 | 16280 | $ 634,104.58 | $ 816,790.76 | $ 829,350.69 | |
| Breakeven = | 0.00 | 49673.03 | 58689.84 | ||||
| Total Net Income | $ 3,914,151.36 | $ 3,969,953.89 | $ 3,349,164.28 | ||||
| Based on this analysis, | your recommendation on how forecast is. | ||||||
Step by Step Solution
There are 3 Steps involved in it
1 Expert Approved Answer
Step: 1 Unlock

Question Has Been Solved by an Expert!
Get step-by-step solutions from verified subject matter experts
Step: 2 Unlock
Step: 3 Unlock