

Question: Please see Appendix A for answers to the odd-numbered y numbered questions. 1. Market researchers have studied the market for milk, and their estimates for
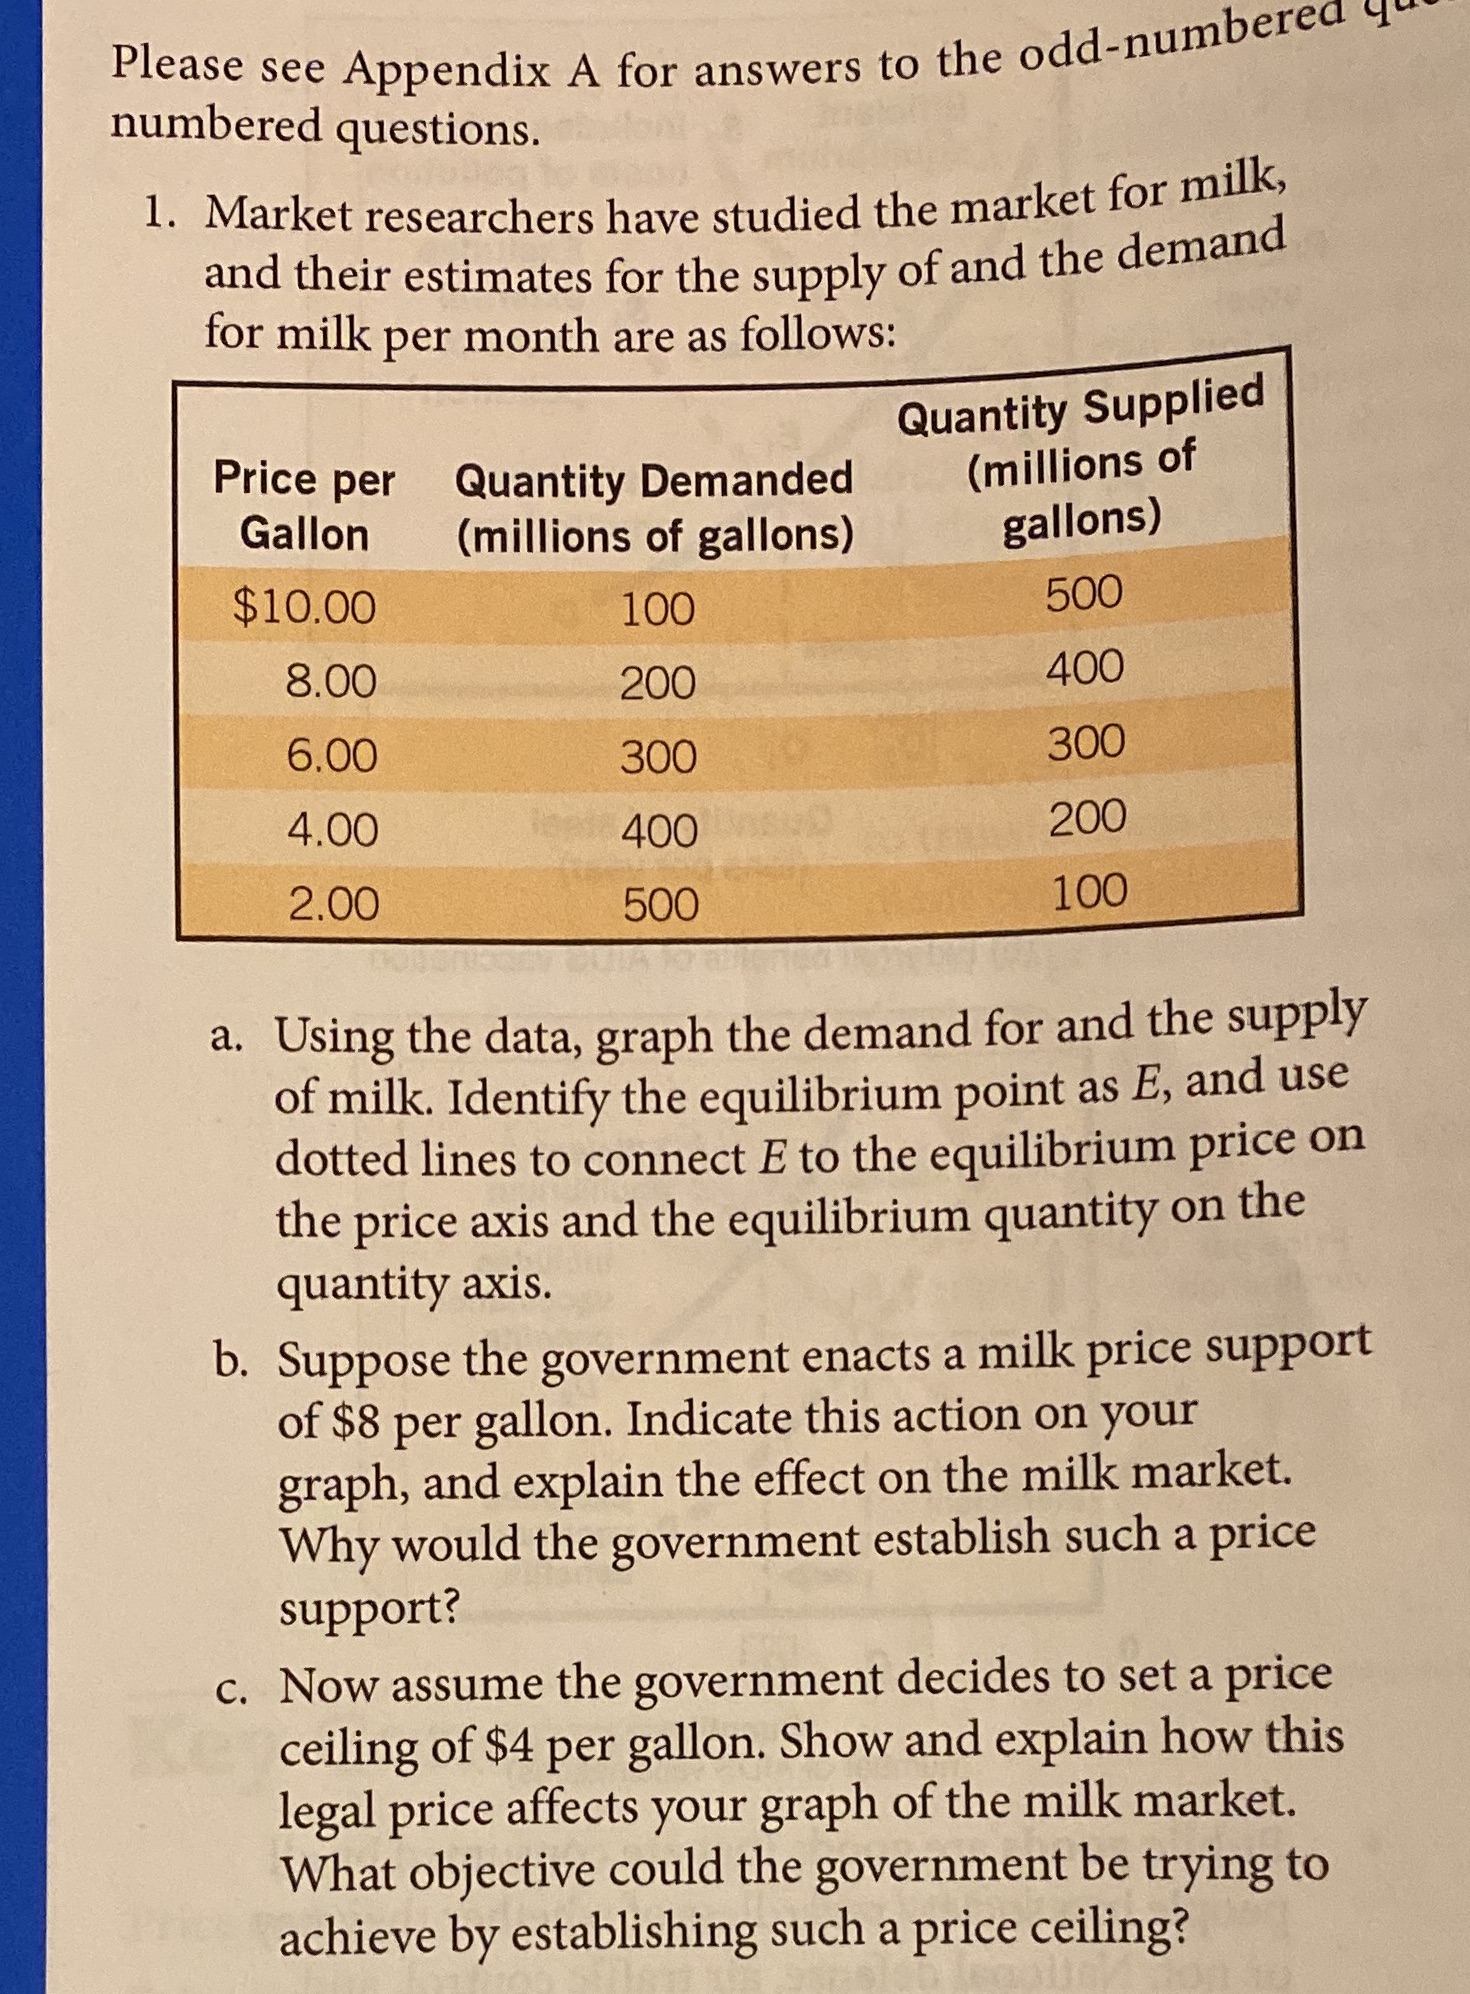
Please see Appendix A for answers to the odd-numbered y numbered questions. 1. Market researchers have studied the market for milk, and their estimates for the supply of and the demand for milk per month are as follows: Quantity Supplied Price per Quantity Demanded (millions of Gallon (millions of gallons) gallons) $10.00 100 500 8.00 200 400 6.00 300 300 4.00 400 200 2.00 500 100 a. Using the data, graph the demand for and the supply of milk. Identify the equilibrium point as E, and use dotted lines to connect E to the equilibrium price on the price axis and the equilibrium quantity on the quantity axis. b. Suppose the government enacts a milk price support of $8 per gallon. Indicate this action on your graph, and explain the effect on the milk market. Why would the government establish such a price support? c. Now assume the government decides to set a price ceiling of $4 per gallon. Show and explain how this legal price affects your graph of the milk market. What objective could the government be trying to achieve by establishing such a price ceiling
Step by Step Solution
There are 3 Steps involved in it

Get step-by-step solutions from verified subject matter experts