

Question: please see below. need help asap. Just need part b. Comparative financial statement data for Oriole Corporation and Pharoah Corporation, two competitors, appear below. All
please see below. need help asap. Just need part b.
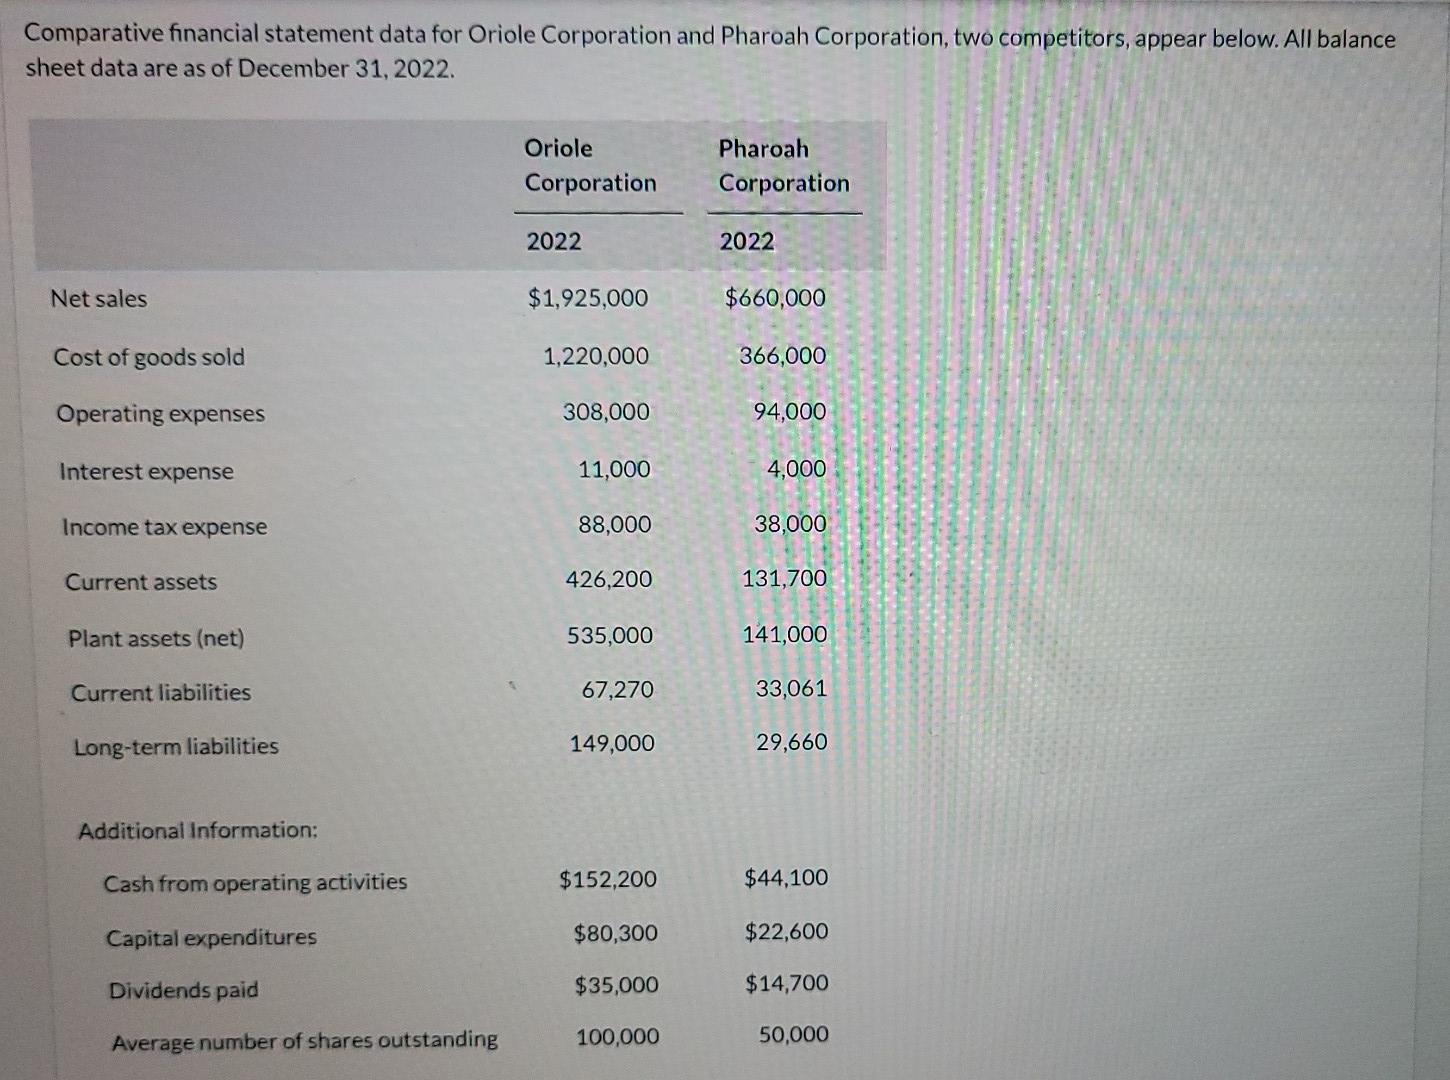
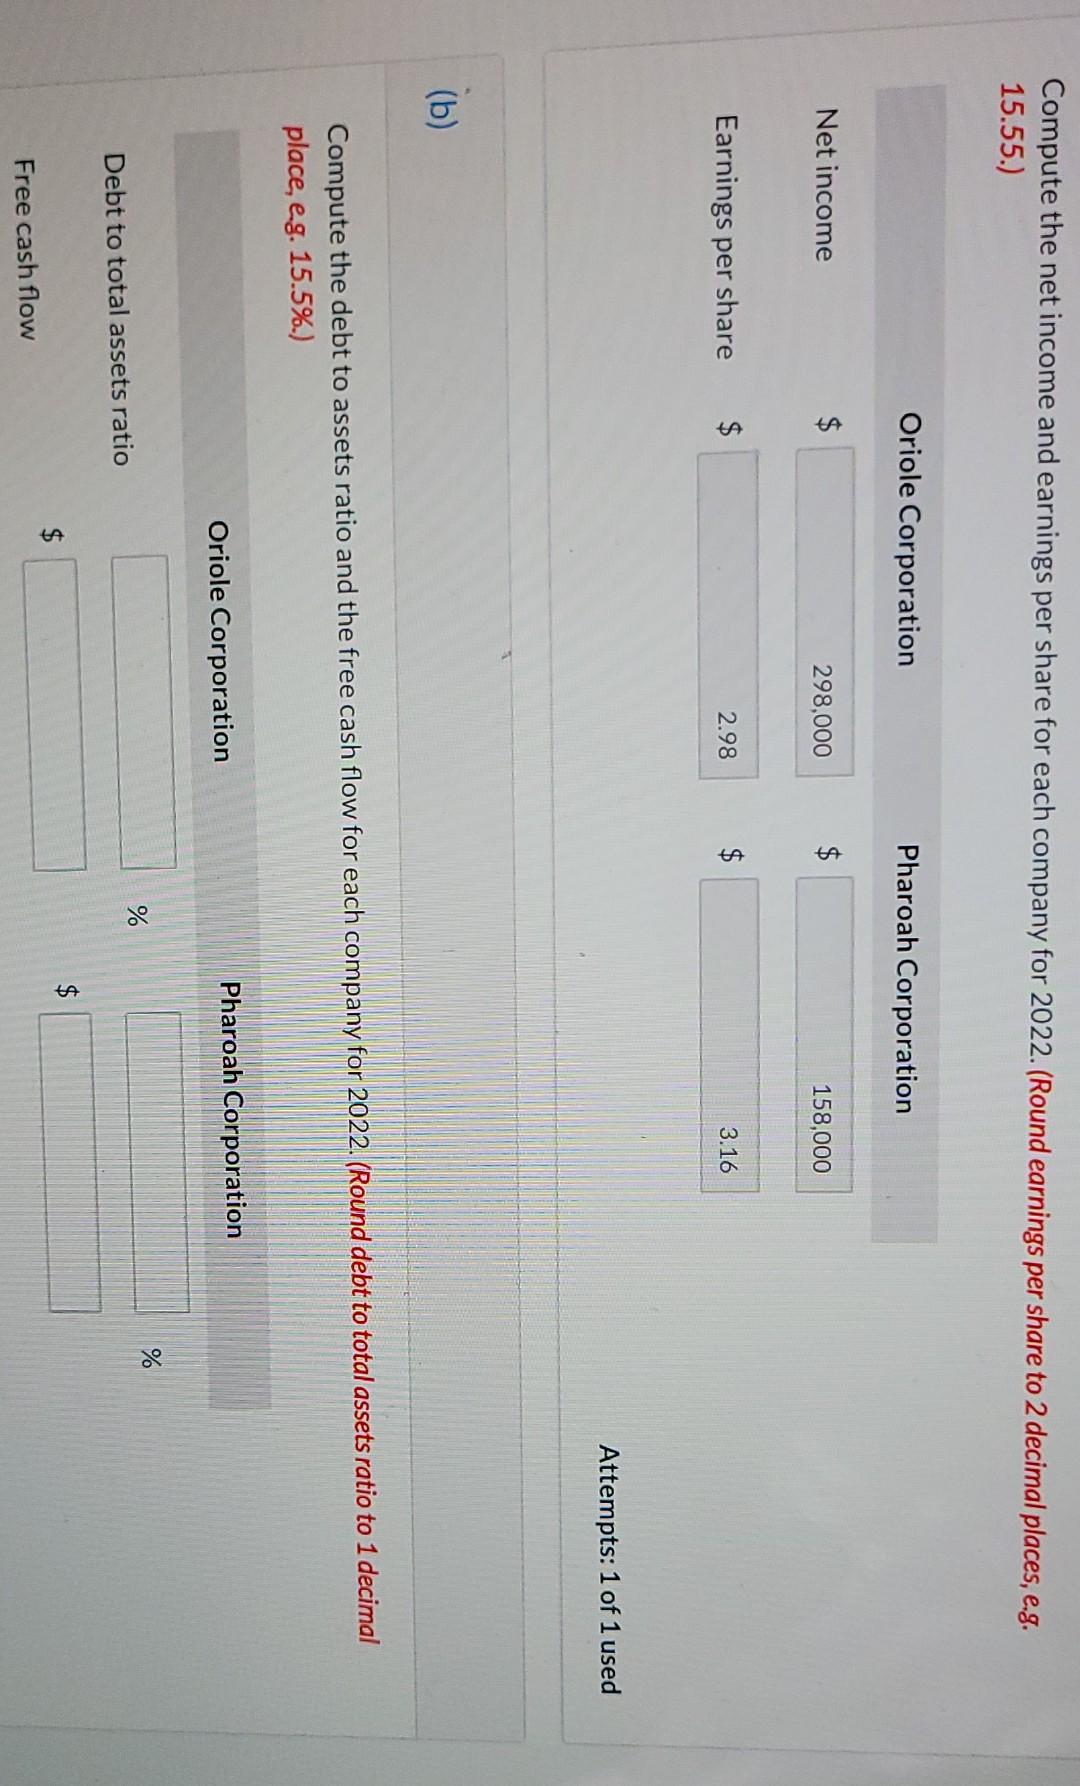
Comparative financial statement data for Oriole Corporation and Pharoah Corporation, two competitors, appear below. All balance sheet data are as of December 31, 2022. Oriole Corporation Pharoah Corporation 2022 2022 Net sales $1,925,000 $660,000 Cost of goods sold 1,220,000 366,000 Operating expenses 308,000 94,000 Interest expense 11,000 4,000 Income tax expense 88,000 38,000 Current assets 426,200 131,700 Plant assets (net) 535,000 141,000 Current liabilities 67,270 33,061 Long-term liabilities 149,000 29,660 Additional Information: Cash from operating activities $152,200 $44,100 Capital expenditures $80,300 $22,600 Dividends paid $35,000 $14,700 Average number of shares outstanding 100,000 50,000 Compute the net income and earnings per share for each company for 2022. (Round earnings per share to 2 decimal places, e.g. 15.55.) Oriole Corporation Pharoah Corporation Net income $ 298,000 $ 158,000 Earnings per share $ 2.98 $ 3.16 Attempts: 1 of 1 used (b) Compute the debt to assets ratio and the free cash flow for each company for 2022. (Round debt to total assets ratio to 1 decimal place, eg. 15.5%.) Oriole Corporation Pharoah Corporation % % Debt to total assets ratio TA $ $ Free cash flow
Step by Step Solution
There are 3 Steps involved in it

Get step-by-step solutions from verified subject matter experts