

Question: please see below The graph illustrates a normal distribution for the prices paid for a particular model of HD television. The mean price paid is
please see below
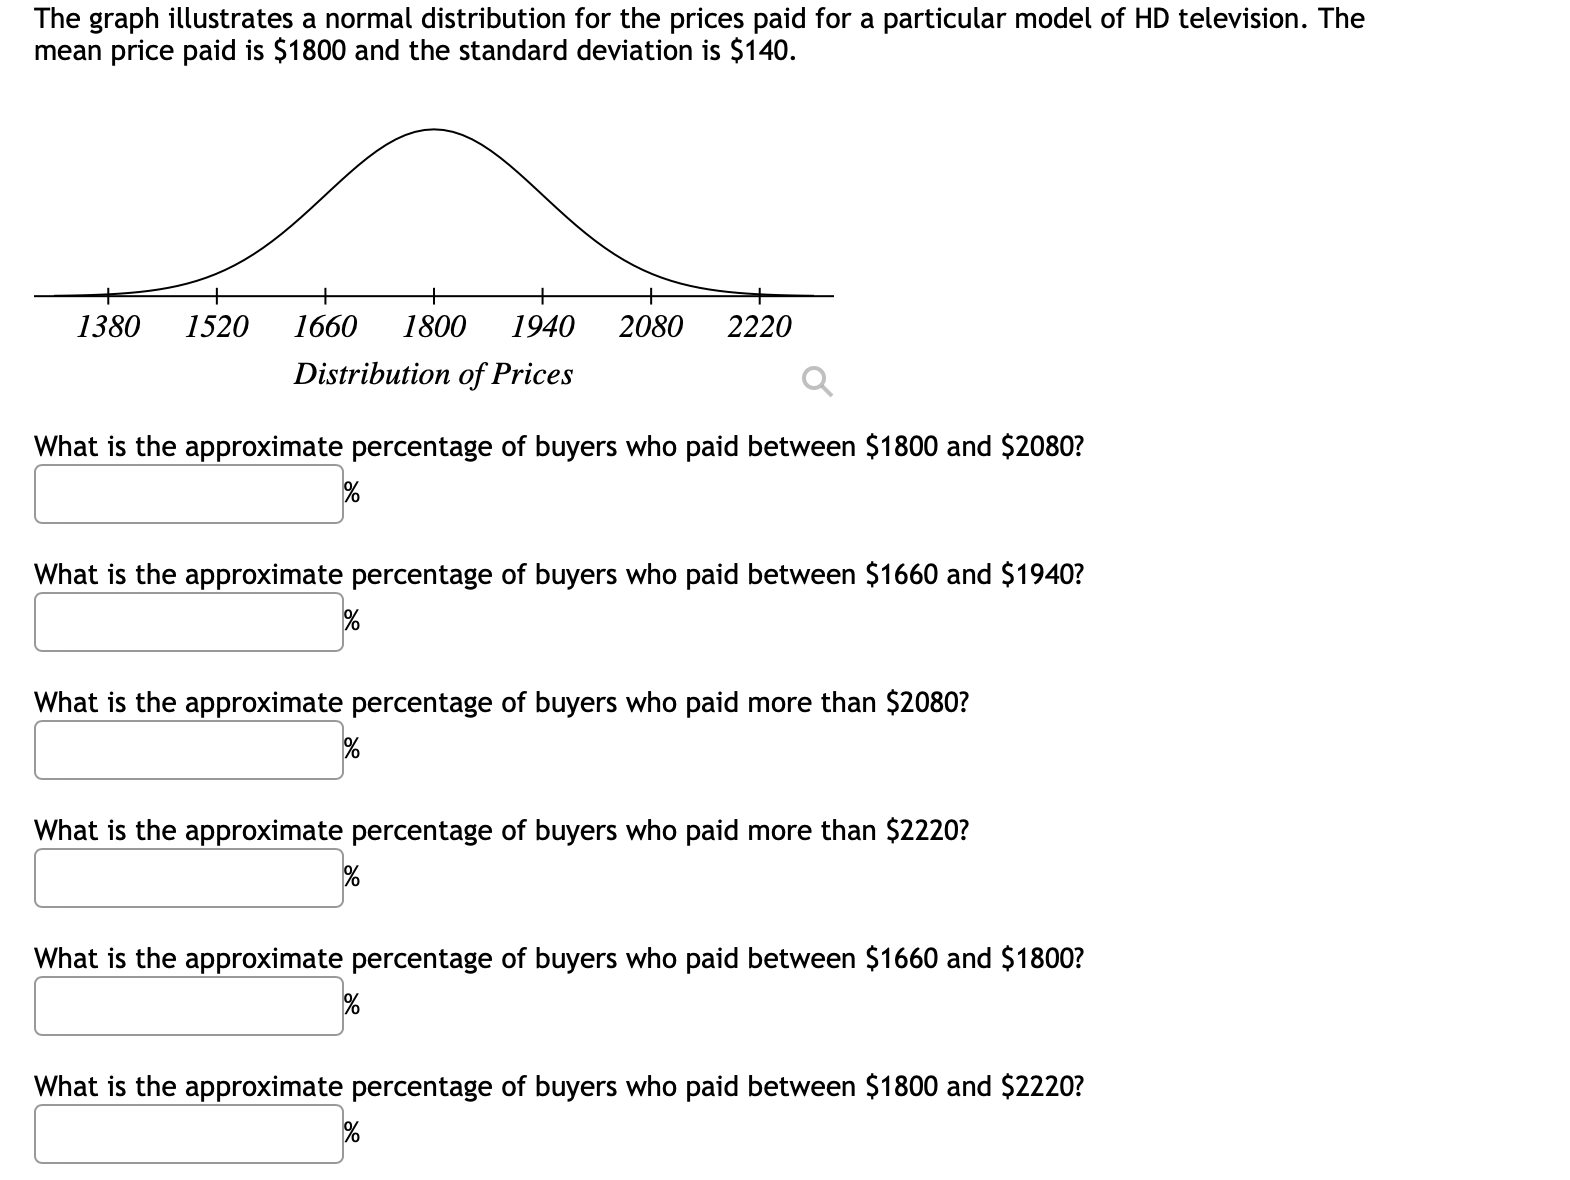
The graph illustrates a normal distribution for the prices paid for a particular model of HD television. The mean price paid is $1800 and the standard deviation is $140. 1380 1520 1660 1800 1940 2080 2220 Distribution of Prices Q What is the approximate percentage of buyers who paid between $1800 and $2080? :96 What is the approximate percentage of buyers who paid between $1660 and $1940? What is the approximate percentage of buyers who paid more than $2080? What is the approximate percentage of buyers who paid more than $2220? :96 What is the approximate percentage of buyers who paid between $1660 and $1800? :96 What is the approximate percentage of buyers who paid between $1800 and $2220? :96
Step by Step Solution
There are 3 Steps involved in it

Get step-by-step solutions from verified subject matter experts