

Question: Please see picture below The data found below measure the amounts of greenhouse gas emissions from three types of vehicles. The measurements are in tons
Please see picture below
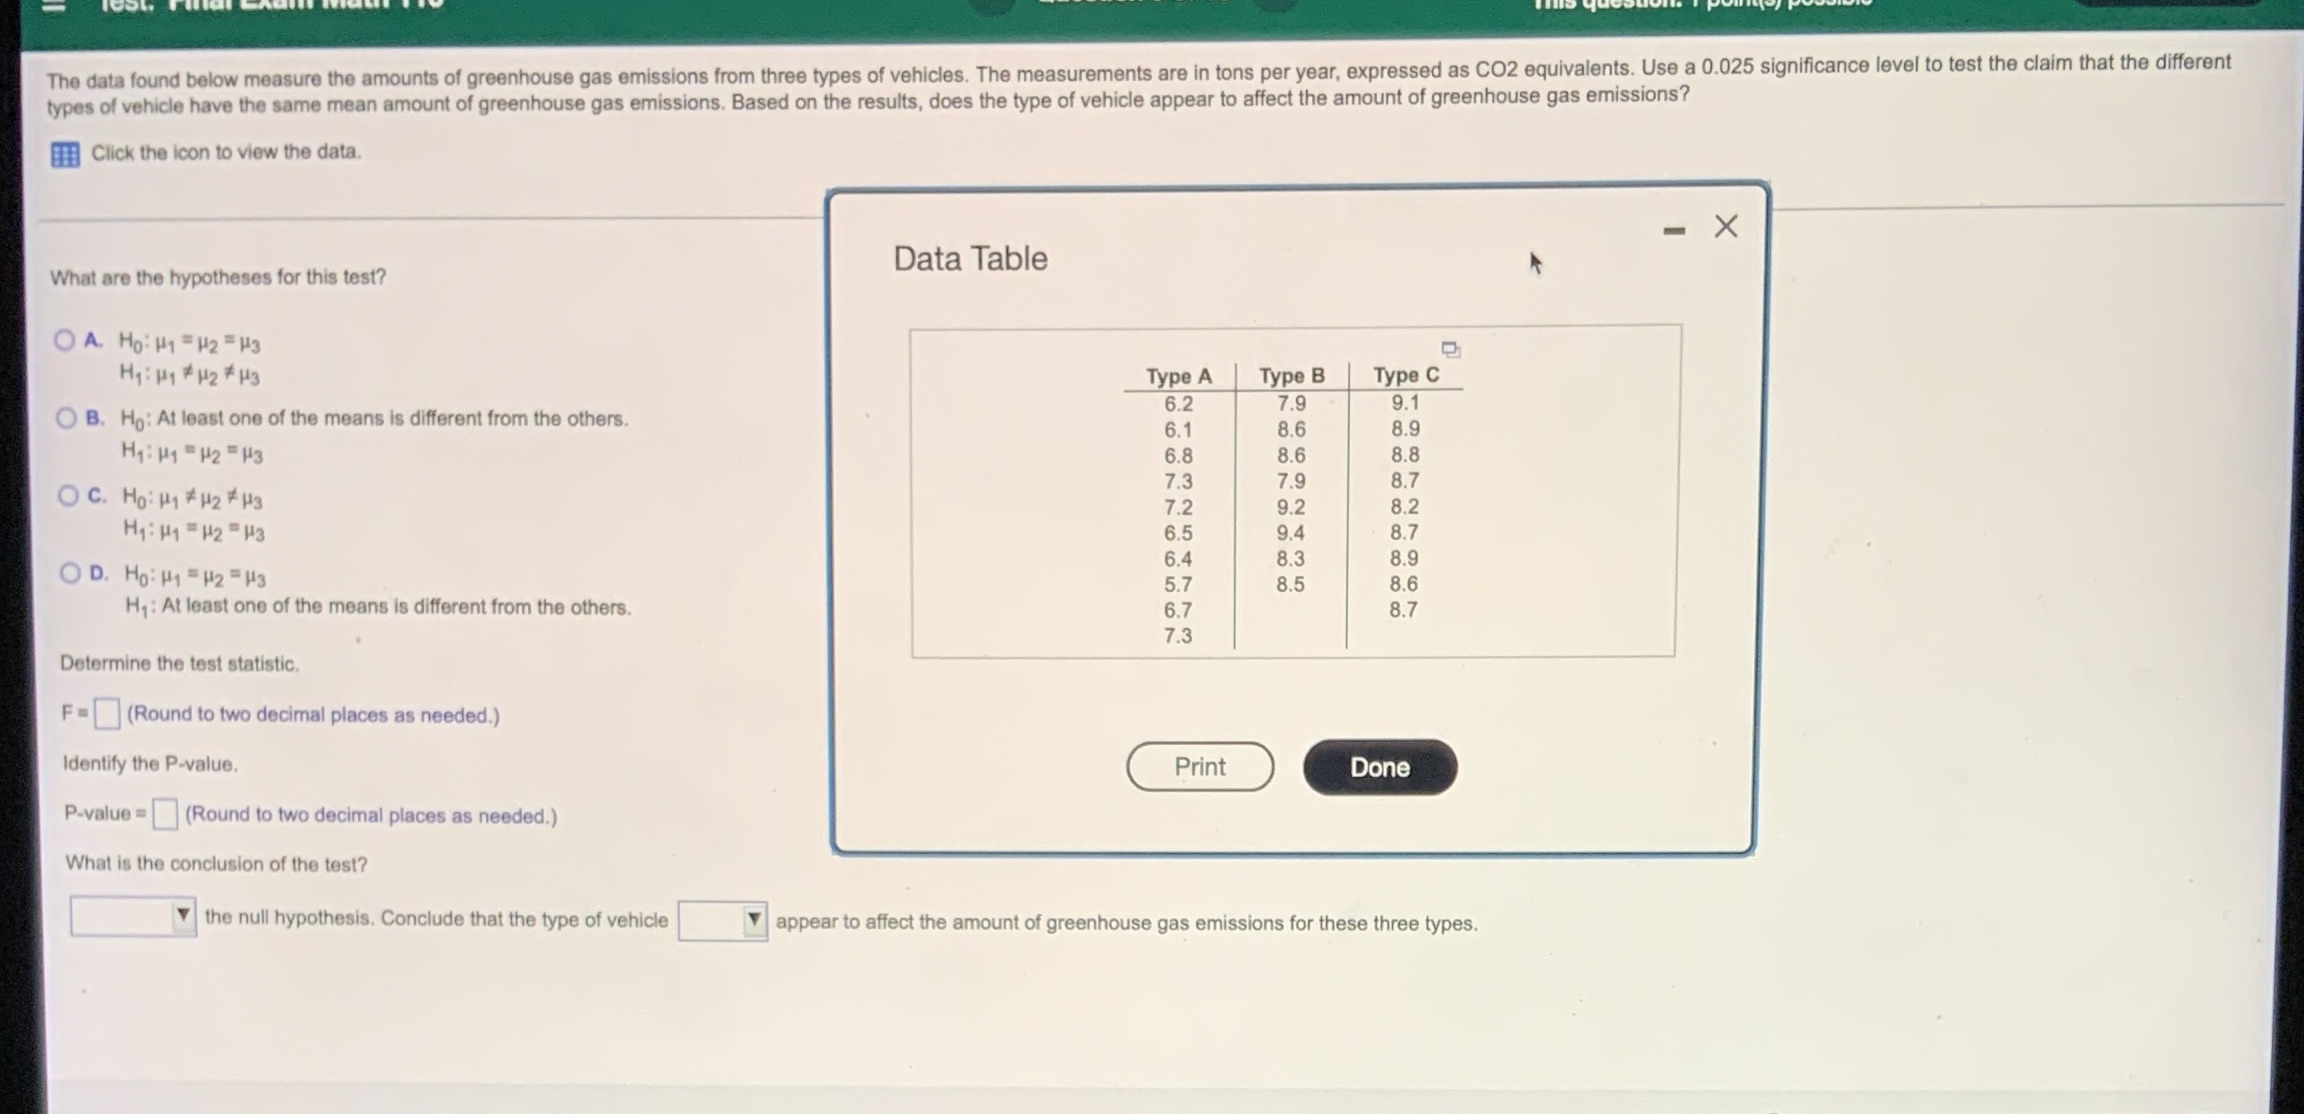
The data found below measure the amounts of greenhouse gas emissions from three types of vehicles. The measurements are in tons per year, expressed as CO2 equivalents. Use a 0.025 significance level to test the claim that the different types of vehicle have the same mean amount of greenhouse gas emissions. Based on the results, does the type of vehicle appear to affect the amount of greenhouse gas emissions? Click the icon to view the data. - X What are the hypotheses for this test? Data Table O A. HO: H1 = H2 = H3 Hy: Hy# H2 # H3 Type A Type B Type C O B. Ho: At least one of the means is different from the others. 6.2 7.9 9.1 6.1 8.6 8.9 H1:14 -H2#H3 6.8 8.6 8.8 O C. Ho: Hy # H2 # H3 7.3 7.9 87 7.2 9.2 8.2 Hy: 141 = H2 " H3 6.5 9.4 8.7 O D. Ho: H1 = H2 = M3 6.4 8.3 8.9 5.7 8.5 8.6 H, : At least one of the means is different from the others. 6.7 8.7 7.3 Determine the test statistic. F =(Round to two decimal places as needed.) Identify the P-value. Print Done P-value = (Round to two decimal places as needed.) What is the conclusion of the test? the null hypothesis. Conclude that the type of vehicle V appear to affect the amount of greenhouse gas emissions for these three types
Step by Step Solution
There are 3 Steps involved in it

Get step-by-step solutions from verified subject matter experts