

Question: Please see table below for both prol table [ [ Points , X Coordinate,Y Coordinate,Z Coordinate ] , [ Reservoir , 9 9 0
Please see table below for both prol
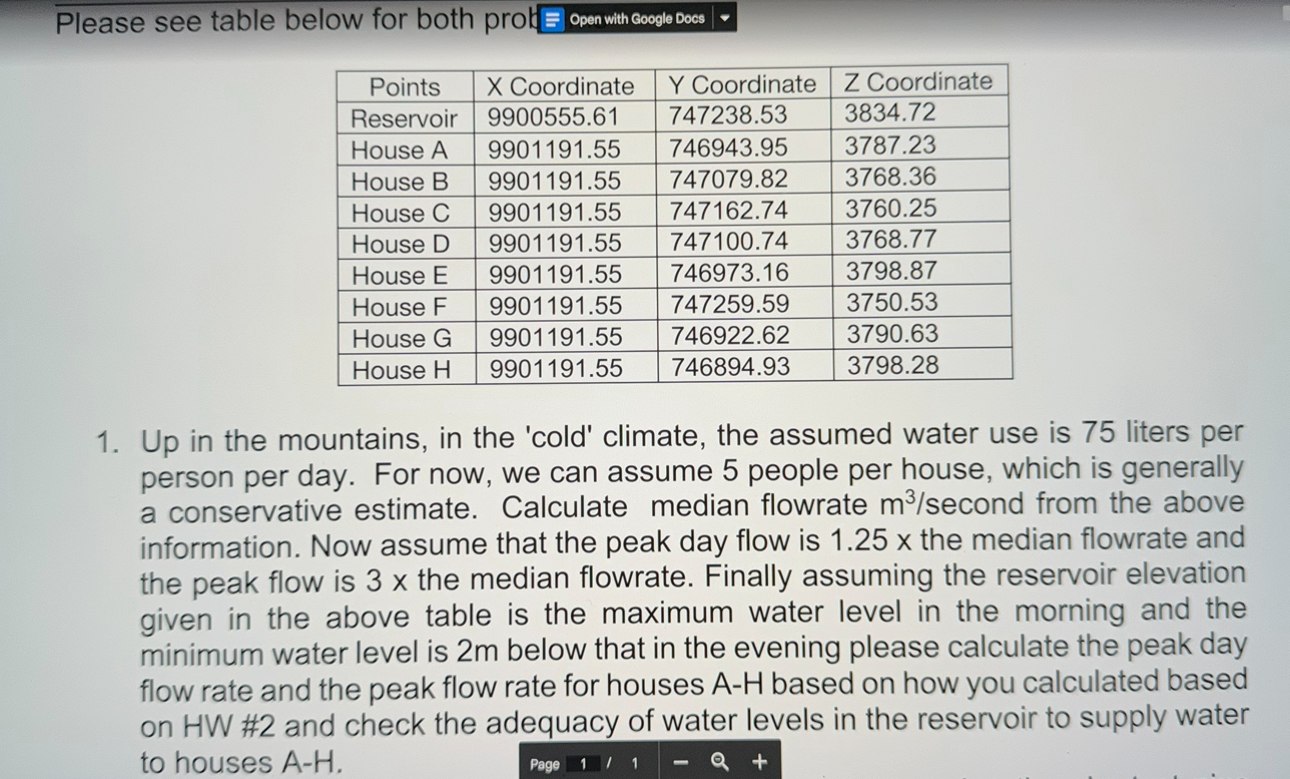
tablePointsX Coordinate,Y Coordinate,Z CoordinateReservoirHouse AHouse BHouse CHouse DHouse EHouse FHouse GHouse H
Up in the mountains, in the 'cold' climate, the assumed water use is liters per person per day. For now, we can assume people per house, which is generally a conservative estimate. Calculate median flowrate second from the above information. Now assume that the peak day flow is the median flowrate and the peak flow is the median flowrate. Finally assuming the reservoir elevation given in the above table is the maximum water level in the morning and the minimum water level is below that in the evening please calculate the peak day flow rate and the peak flow rate for houses based on how you calculated based on HW # and check the adequacy of water levels in the reservoir to supply water to houses AH
Step by Step Solution
There are 3 Steps involved in it
1 Expert Approved Answer
Step: 1 Unlock

Question Has Been Solved by an Expert!
Get step-by-step solutions from verified subject matter experts
Step: 2 Unlock
Step: 3 Unlock