

Question: Please see the below screen shot reference the question In a study of the relationship between daily high temperature and ice cream sales. a regression
Please see the below screen shot reference the question
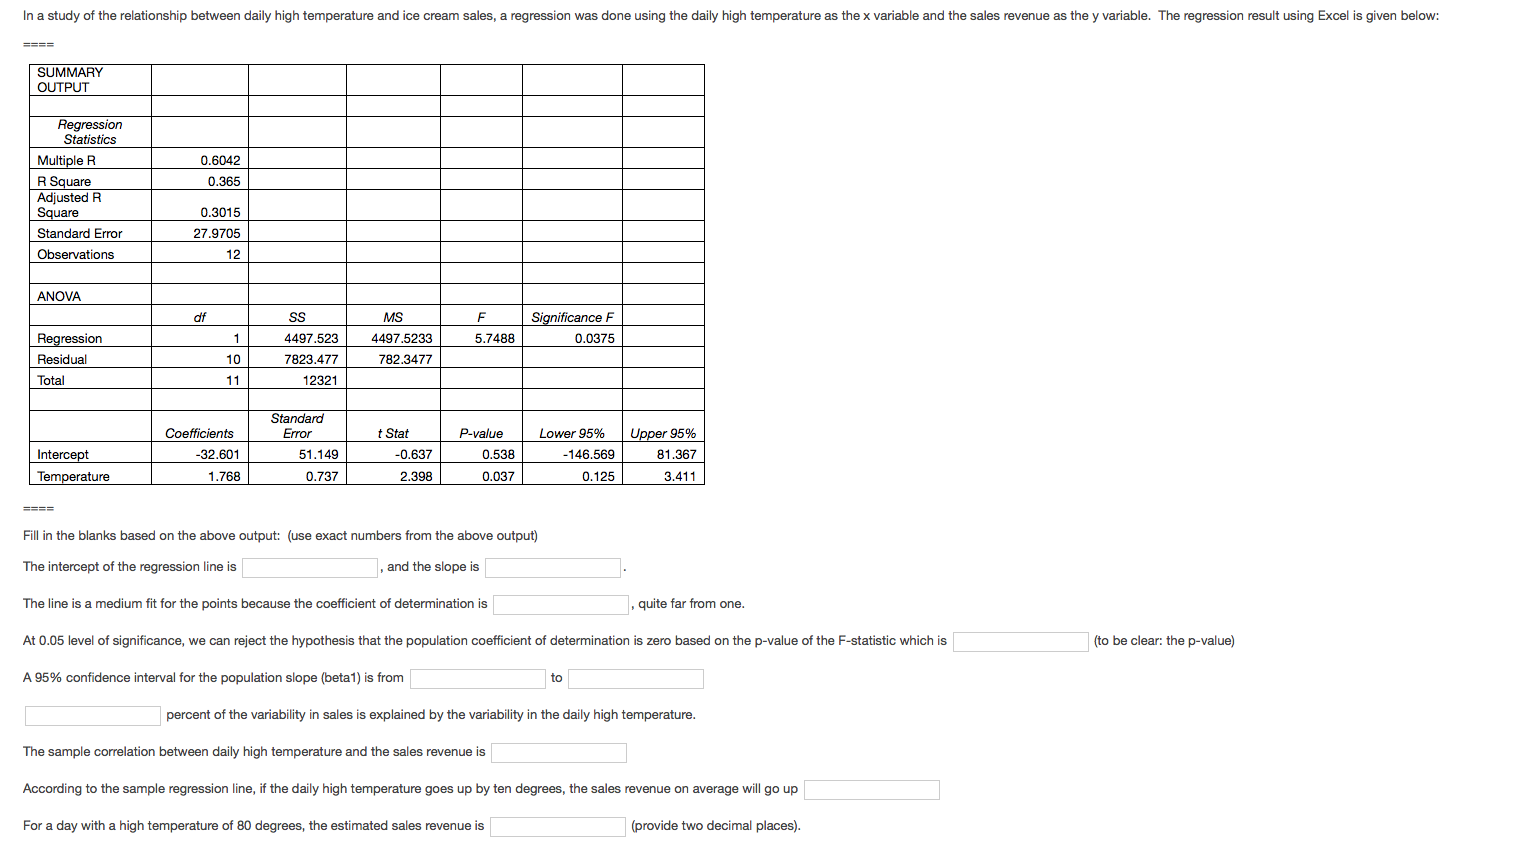
In a study of the relationship between daily high temperature and ice cream sales. a regression was done using the daiiy high temperature as thex variable and the sales revenue as the yvariabte. The regression result using Excel is given below: Multiple Fl 0.6042 Ft Square 0.365 Adjusted R Square 0.3015 Standard Error 27.9705 Observations 1! ANOVA of 53 M? F Signicance F Hegreesion 1 4497.523 44915233 5.7488 0.0375 Residual 10 7823.47? 732.3477 Tate] 11 12321 Sheridan! Cbe'rcients Error (Stat Fevatua Lower 95% Upper95'36 Intercept 732.601 51.149 70.637 0.538 7145.569 31.357 Temperature 1.76! 0.737 2.3m 0.037 0.125 3.411 Fili in the bianks based on the above output: [use exact numbers from the above output) The intercept of the regression line is , and the slope is Th- line is a medium lit for the points because the ooel'flcl t at determination is ,quite far from one. At 0.05 level at signicance, we can rejem the hypothesis that thl populaticn coefcient of determination is It!) based on the p-value at th- Fstatistic which is {to be clear: the pvalue) A 95% condence intervai tor the population slope (beta1) is trorn to percent of the variability in sales is expiained by the variability in the daily high temperature. The sample oorrelatinn between daily high temperature and the sales revenue is According to the sampie regmsidn line, if the daily high temperature gm up byten degrees. the sales revenue on avemg- wiil go up For a day with a high temperature d1 00 degrees, the estimated sales revenue is (provide twu decimal places]
Step by Step Solution
There are 3 Steps involved in it

Get step-by-step solutions from verified subject matter experts