Question: Please see the data used after the question below For each of the scenarios below, use Excel to access the data (See the instructions of
Please see the data used after the question below
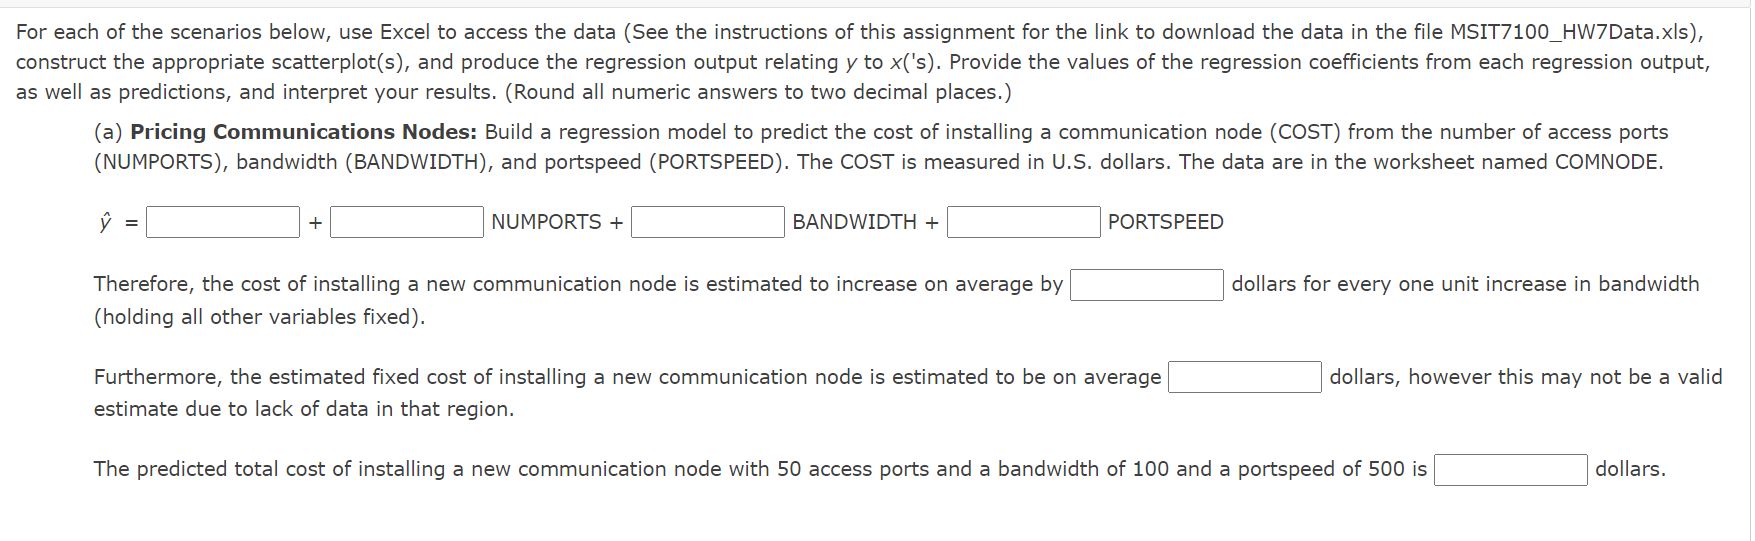
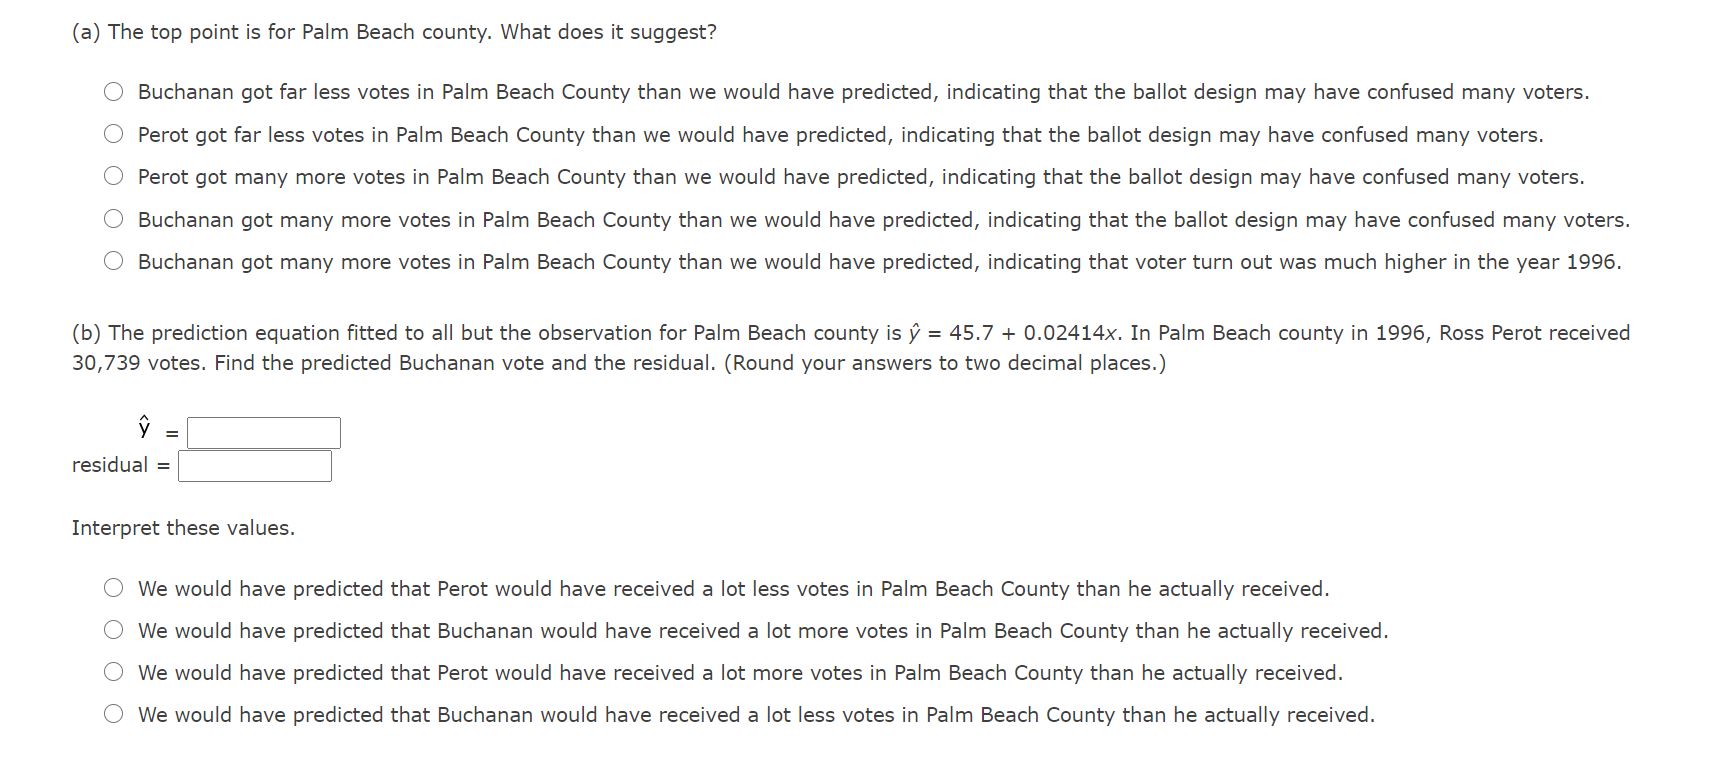
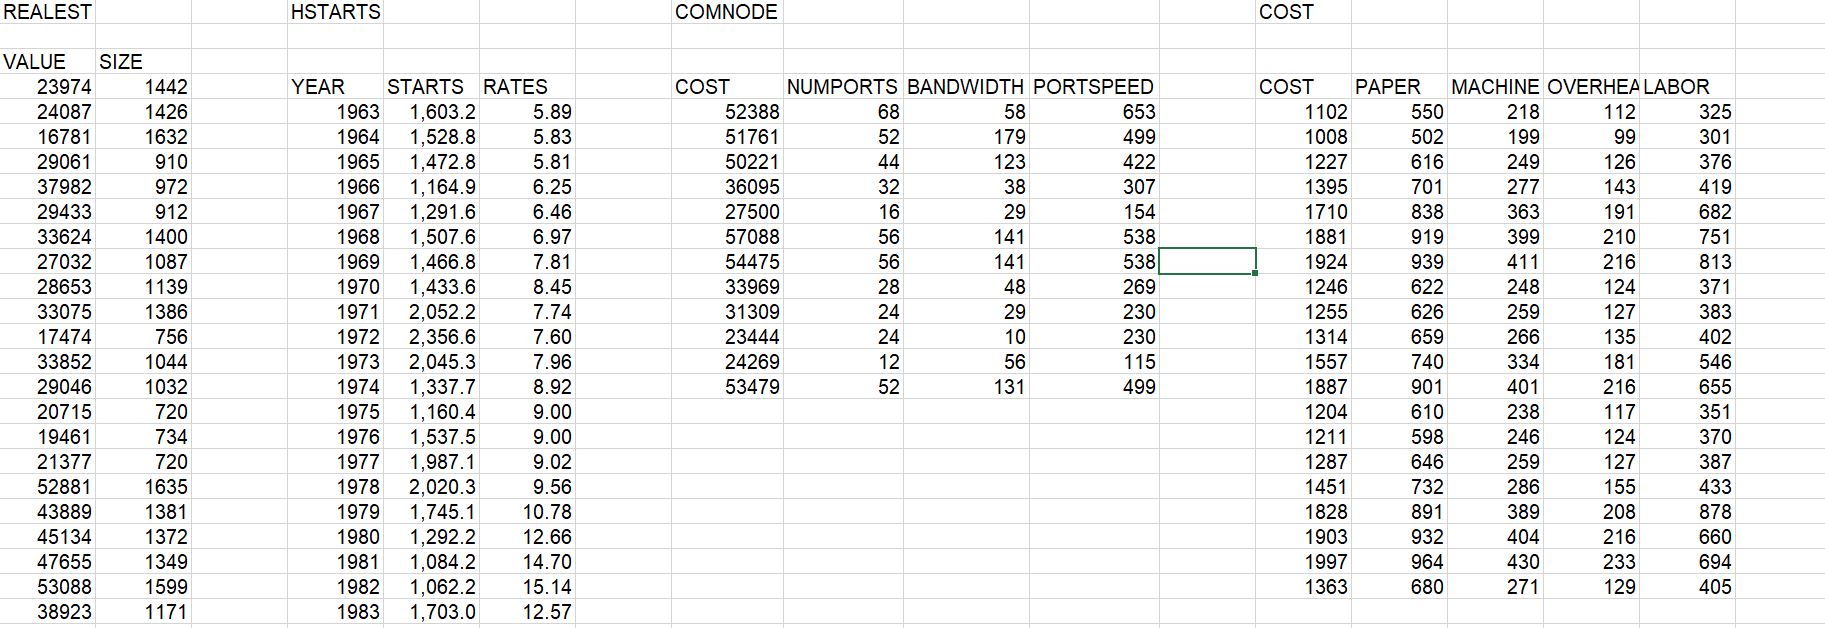
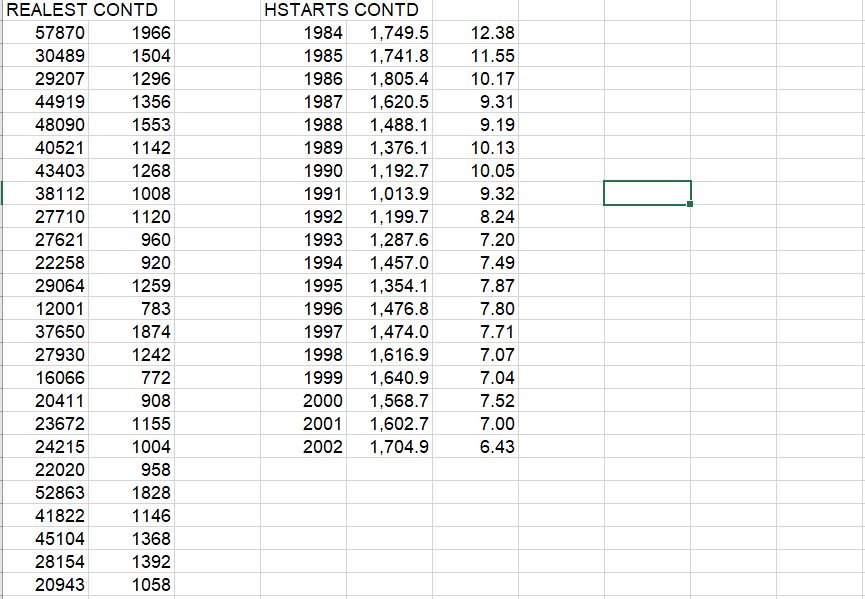
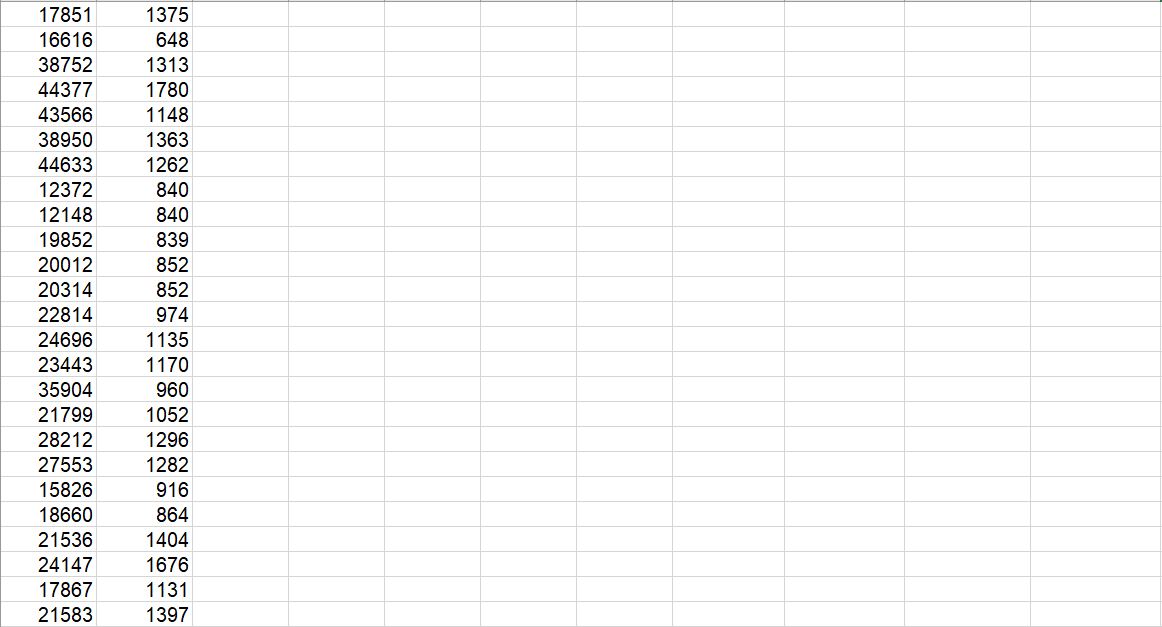
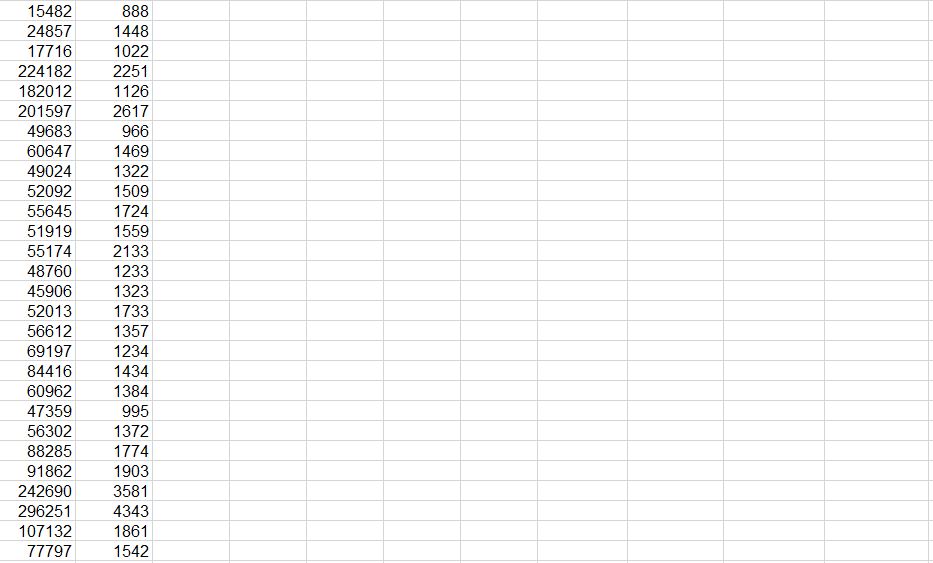
For each of the scenarios below, use Excel to access the data (See the instructions of this assignment for the link to download the data in the le MSIT71007HW7Data.xls), construct the appropriate scatterplot(s), and produce the regression output relating y to x('s). Provide the values of the regression coefcients from each regression output, as well as predictions, and interpret your results. (Round all numeric answers to two decimal places.) (a) Pricing Communications Nodes: Build a regression model to predict the cost of installing a communication node (COST) from the number of access ports (NUMPORTS), bandwidth (BANDWIDTH), and portspeed (PORTSPEED). The COST is measured in U.S. dollars. The data are in the worksheet named COMNODE. Therefore, the cost of installing a new communication node is estimated to increase on average by S dollars for every one unit increase in bandwidth (holding all other variables xed). Furthermore, the estimated fixed cost of installing a new communication node is estimated to be on average I: dollars, however this may not be a valid estimate due to lack of data in that region. The predicted total cost of installing a new communication node with 50 access ports and a bandwidth of 100 and a portspeed of 500 is \\:| dollars. (a) The top point is for Palm Beach county. What does it suggest? O Buchanan got far less votes in Palm Beach County than we would have predicted, indicating that the ballot design may have confused many voters. Perot got far less votes in Palm Beach County than we would have predicted, indicating that the ballot design may have confused many voters. Perot got many more votes in Palm Beach County than we would have predicted, indicating that the ballot design may have confused many voters. Buchanan got many more votes in Palm Beach County than we would have predicted, indicating that the ballot design may have confused many voters. OOOO Buchanan got many more votes in Palm Beach County than we would have predicted, indicating that voter turn out was much higher in the year 1996. (b) The prediction equation tted to all but the observation for Palm Beach county is P = 45.7 + 0.02414X. In Palm Beach county in 1996, Ross Perot received 30,739 votes. Find the predicted Buchanan vote and the residual. (Round your answers to two decimal places.) ? =: Interpret these values. 0 We would have predicted that Perot would have received a lot less votes in Palm Beach County than he actually received. 0 We would have predicted that Buchanan would have received a lot more votes in Palm Beach County than he actually received. 0 We would have predicted that Perot would have received a lot more votes in Palm Beach County than he actually received. 0 We would have predicted that Buchanan would have received a lot less votes in Palm Beach County than he actually received. \f\f\f\f