

Question: please see whole question below with data table This pilot study aimed to examine the effect of Low-Glycemic diet on gestational weight gain impregnant women.

please see whole question below with data table
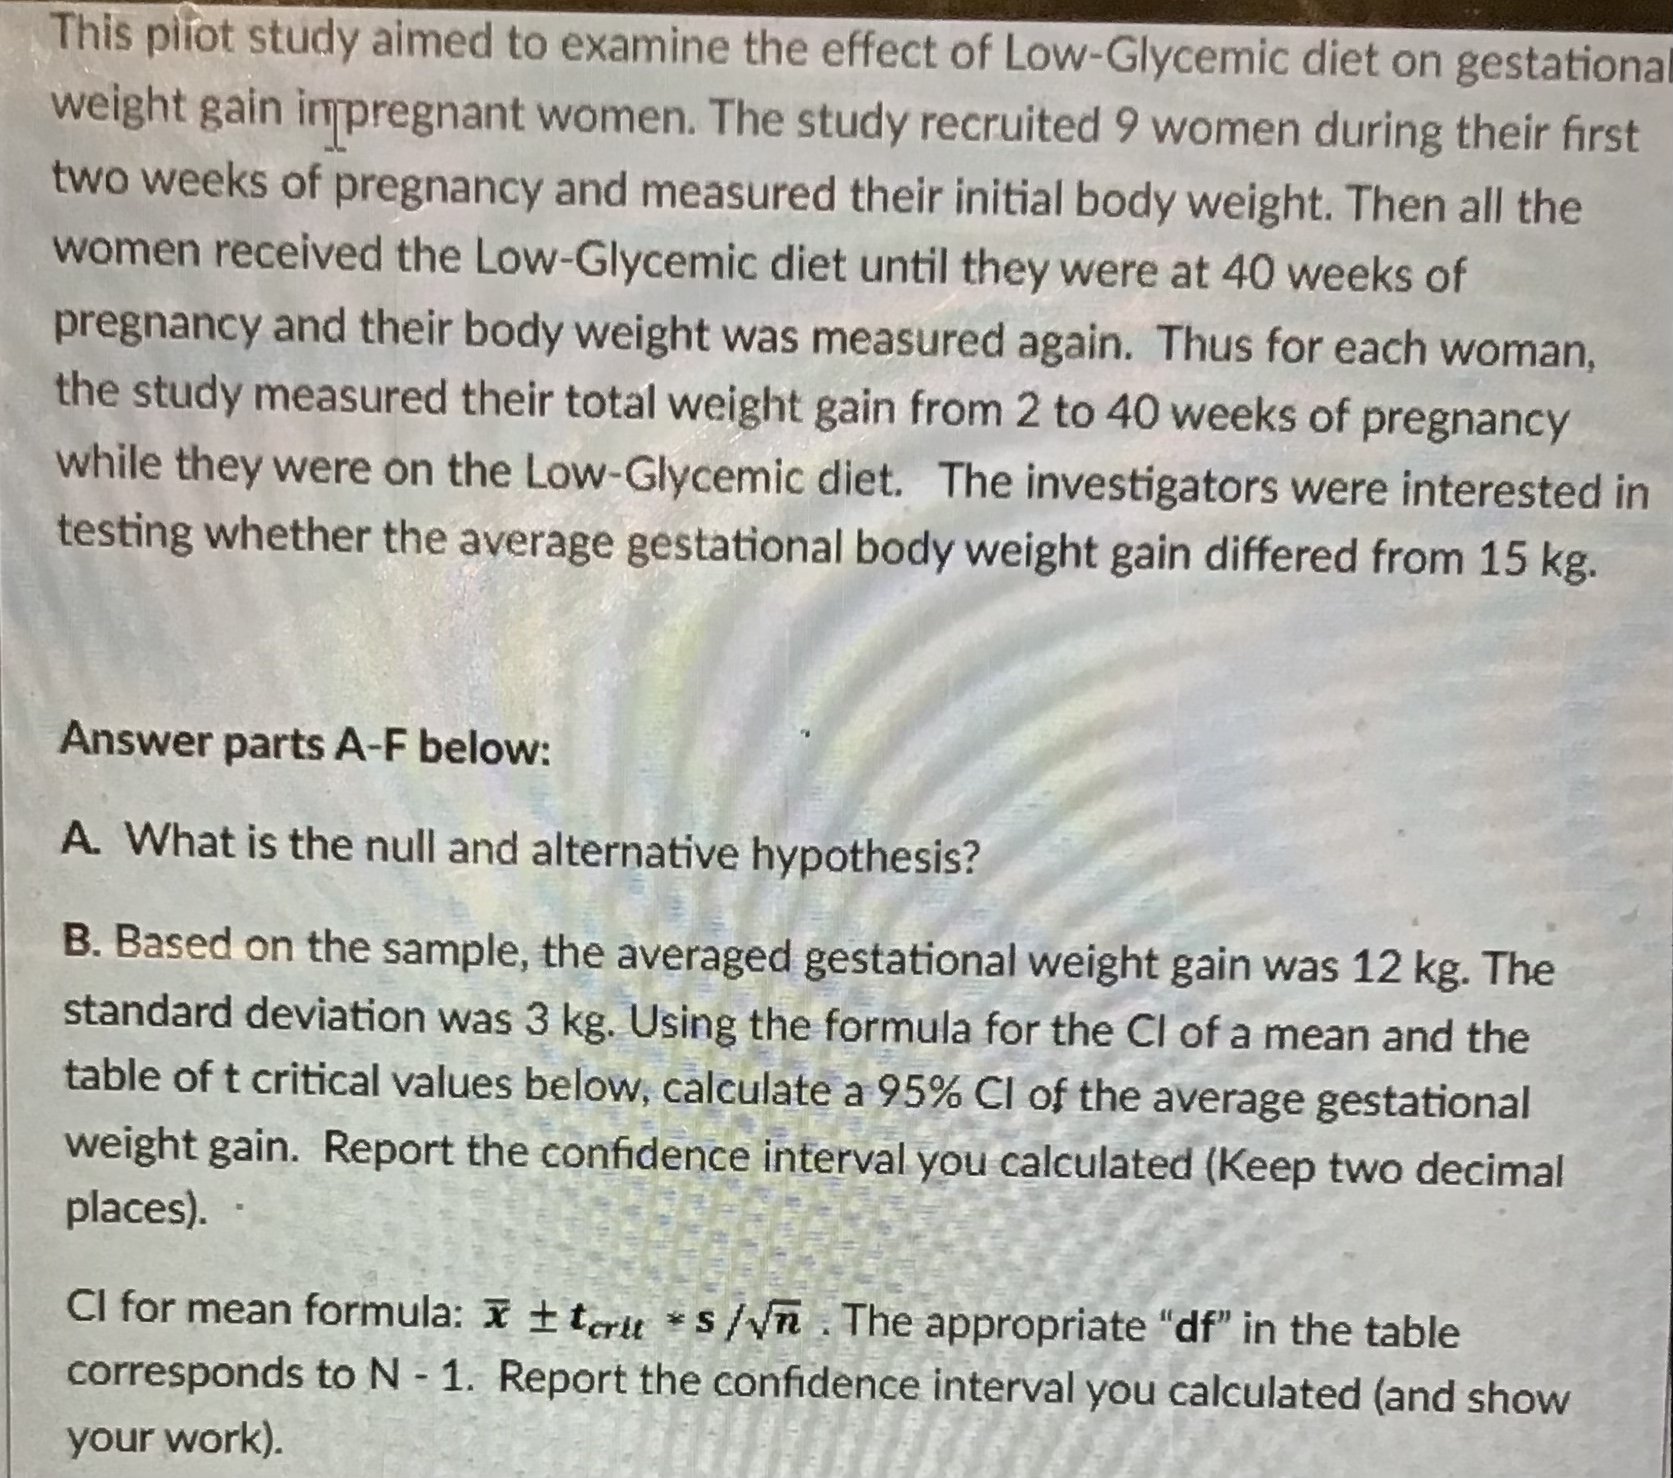

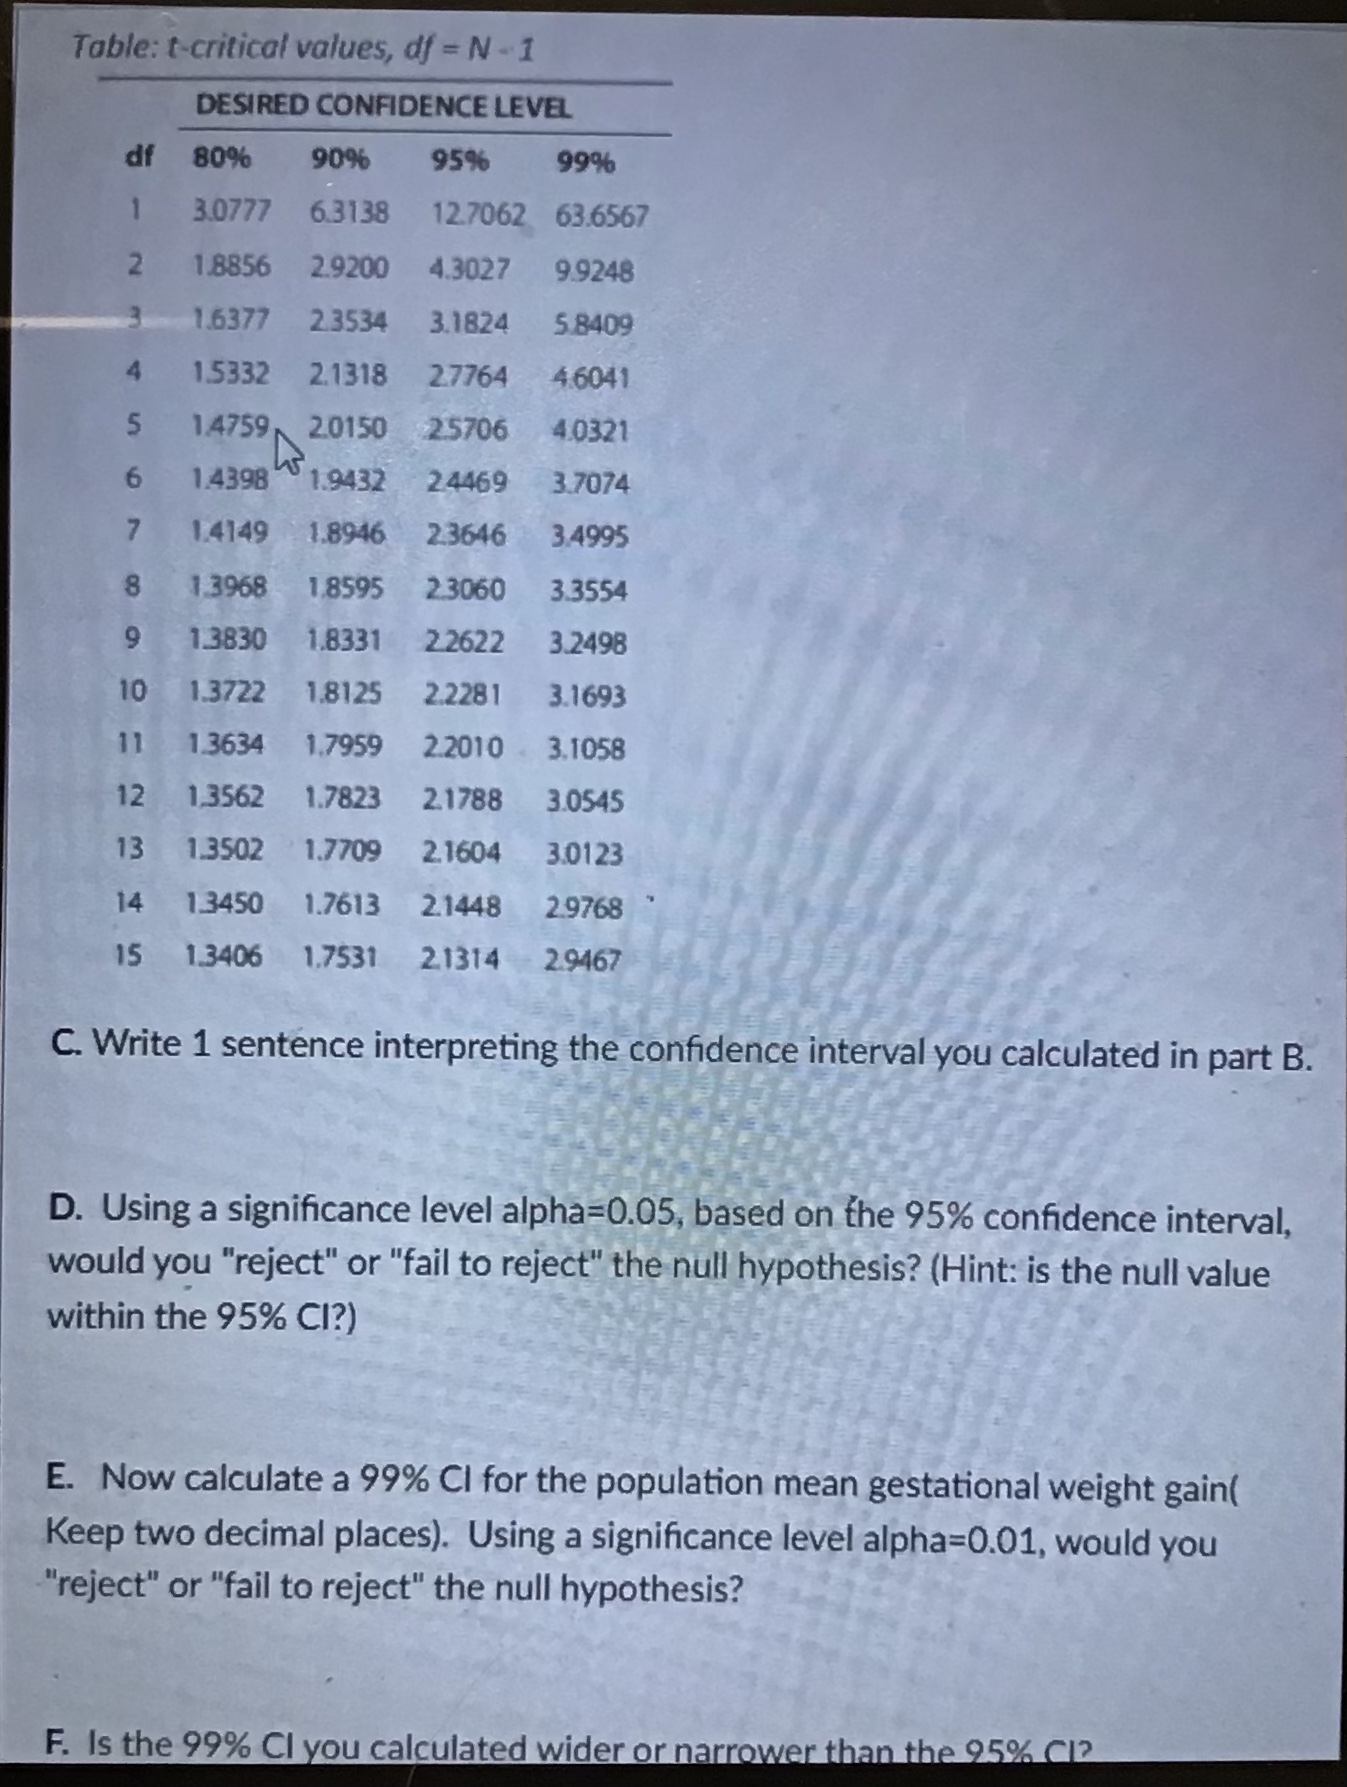
This pilot study aimed to examine the effect of Low-Glycemic diet on gestational weight gain impregnant women. The study recruited 9 women during their first two weeks of pregnancy and measured their initial body weight. Then all the women received the Low-Glycemic diet until they were at 40 weeks of pregnancy and their body weight was measured again. Thus for each woman, the study measured their total weight gain from 2 to 40 weeks of pregnancy while they were on the Low-Glycemic diet. The investigators were interested in testing whether the average gestational body weight gain differed from 15 kg. Answer parts A-F below: A. What is the null and alternative hypothesis? B. Based on the sample, the averaged gestational weight gain was 12 kg. The standard deviation was 3 kg. Using the formula for the Cl of a mean and the table of t critical values below, calculate a 95% CI of the average gestational weight gain. Report the confidence interval you calculated (Keep two decimal places). CI for mean formula: X 1 toru * s /Vn . The appropriate "df" in the table corresponds to N - 1. Report the confidence interval you calculated (and show your work).Table: t-critical values, of = N - 1 DESIRED CONFIDENCE LEVEL df 80% 90% 95% 99% 1 3.0777 6.3138 12.7062 63.6567 2 1.8856 2.9200 4.3027 9.9248 1.6377 2.3534 3.1824 5.8409 4 1.5332 2.1318 2.7764 46041 5 14759 20150 25706 4.0321 6 1.4398 19432 24469 3.7074 7 1:4149 1.8946 2:3646 3.4995 8 1.3968 1.8595 2.3060 3.3554 9 1.3830 1.8331 2.2622 3.2498 10 1.3722 1.8125 2.2281 3.1693 11 1.3634 1.7959 2.2010 . 3.1058 12 1,3562 1.7823 2.1788 3.0545 13 1.3502 1.7709 2.1604 3.0123 14 1.3450 1.7613 2.1448 29768 15 1.3406 1.7531 2.1314 29467 C. Write 1 sentence interpreting the confidence interval you calculated in part B. D. Using a significance level alpha=0.05, based on the 95% confidence interval, would you "reject" or "fail to reject" the null hypothesis? (Hint: is the null value within the 95% CI?) E. Now calculate a 99% CI for the population mean gestational weight gain( Keep two decimal places). Using a significance level alpha=0.01, would you "reject" or "fail to reject" the null hypothesis? F. Is the 99% CI you calculated wider or narrower than the 95% C12
Step by Step Solution
There are 3 Steps involved in it

Get step-by-step solutions from verified subject matter experts