

Question: Please show a step by step worked out solution on excel Please show step-by-step solution on excel. Can you show which equations are being used?
Please show a step by step worked out solution on excel 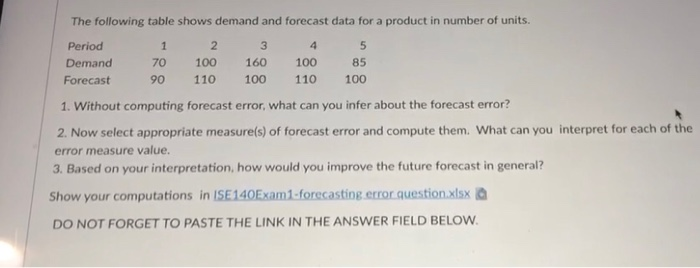
Please show step-by-step solution on excel. Can you show which equations are being used?
The following table shows demand and forecast data for a product in number of units. Period 1 2 3 4 5 Demand 70 100 160 100 85 Forecast 90 110 100 110 100 1. Without computing forecast error, what can you infer about the forecast error? 2. Now select appropriate measure(s) of forecast error and compute them. What can you interpret for each of the error measure value. 3. Based on your interpretation, how would you improve the future forecast in general? Show your computations in ISE 140Exam 1-forecasting error question.xlsx DO NOT FORGET TO PASTE THE LINK IN THE ANSWER FIELD BELOW
Step by Step Solution
There are 3 Steps involved in it
1 Expert Approved Answer
Step: 1 Unlock

Question Has Been Solved by an Expert!
Get step-by-step solutions from verified subject matter experts
Step: 2 Unlock
Step: 3 Unlock