

Question: Please show all excel formulas and/or functions to complete this question. Stock A and Stock B prices and dividends, along with the Market Index, are
Please show all excel formulas and/or functions to complete this question.
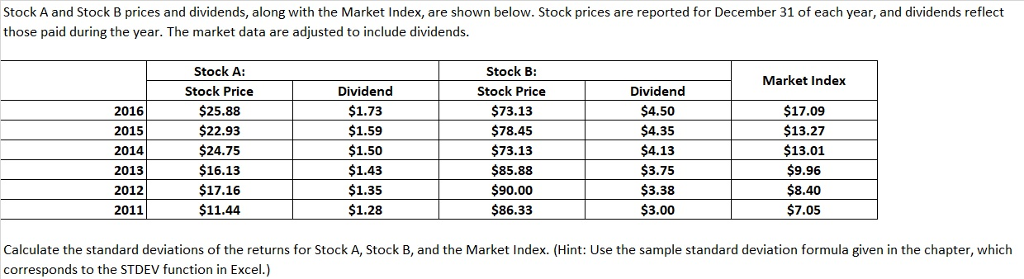
Stock A and Stock B prices and dividends, along with the Market Index, are shown below. Stock prices are reported for December 31 of each year, and dividends reflect those paid during the year. The market data are adjusted to include dividends. Stock A: Stock Price $25.88 $22.93 $24.75 $16.13 $17.16 $11.44 Stock B: Stock Price $73.13 $78.45 $73.13 $85.88 90.00 $86.33 Market Index 2016 2015 2014 2013 2012 2011 Dividend $1.73 $1.59 $1.50 $1.43 $1.35 $1.28 Dividend $4.50 $4.35 $4.13 $3.75 $3.38 $3.00 $17.09 $13.27 $13.01 $9.96 $8.40 $7.05 Calculate the standard deviations of the returns for Stock A, Stock B, and the Market Index. (Hint: Use the sample standard deviation formula given in the chapter, which corresponds to the STDEV function in Excel.)
Step by Step Solution
There are 3 Steps involved in it

Get step-by-step solutions from verified subject matter experts