

Question: Please show ALL formulas o. Noy conduct a scenario analysis. Assume that there is a 25% probability that best-case conditions, with each of the variables
Please show ALL formulas
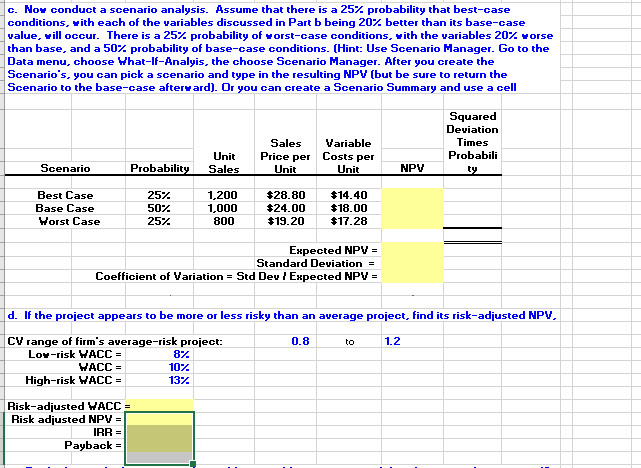
o. Noy conduct a scenario analysis. Assume that there is a 25% probability that best-case conditions, with each of the variables discussed in Part b being 20% better than its base-case value, will occur. There is a 25% probability of worst-case conditions, with the variables 20% worse than base, and a 50% probability of base-case conditions. (Hint: Use Scenario Manager. Go to the Data menu, choose What-if-Analyis, the choose Scenario Manager. After you create the Scenario's, you can pick a scenario and type in the resulting NPV (but be sure to return the Scenario to the base-case afterward). Or you can create a Scenario Summary and use a cell Squared Deviation Times Probabili ty Sales Variable Price per Costs per Unit Init Scenario Unit Sales Probability NPV Best Case Base Case Worst Case 25% 50% 1,200 1,000 800 $28.80 $24.00 $19.20 $14.40 $18.00 $17.28 25%. Expected NPV = Standard Deviation = Coefficient of Variation = Std Dev / Expected NPV = d. If the project appears to be more or less risky than an average project, find its risk-adjusted NPV, 0.8 to 1.2 CV range of firm's average-risk project: Lor-risk WACC = 87 WACC = 10% High-risk WACC = 137 Risk-adjusted WACC = Risk adjusted NPV = IRR = Payback = o. Noy conduct a scenario analysis. Assume that there is a 25% probability that best-case conditions, with each of the variables discussed in Part b being 20% better than its base-case value, will occur. There is a 25% probability of worst-case conditions, with the variables 20% worse than base, and a 50% probability of base-case conditions. (Hint: Use Scenario Manager. Go to the Data menu, choose What-if-Analyis, the choose Scenario Manager. After you create the Scenario's, you can pick a scenario and type in the resulting NPV (but be sure to return the Scenario to the base-case afterward). Or you can create a Scenario Summary and use a cell Squared Deviation Times Probabili ty Sales Variable Price per Costs per Unit Init Scenario Unit Sales Probability NPV Best Case Base Case Worst Case 25% 50% 1,200 1,000 800 $28.80 $24.00 $19.20 $14.40 $18.00 $17.28 25%. Expected NPV = Standard Deviation = Coefficient of Variation = Std Dev / Expected NPV = d. If the project appears to be more or less risky than an average project, find its risk-adjusted NPV, 0.8 to 1.2 CV range of firm's average-risk project: Lor-risk WACC = 87 WACC = 10% High-risk WACC = 137 Risk-adjusted WACC = Risk adjusted NPV = IRR = Payback =
Step by Step Solution
There are 3 Steps involved in it

Get step-by-step solutions from verified subject matter experts