

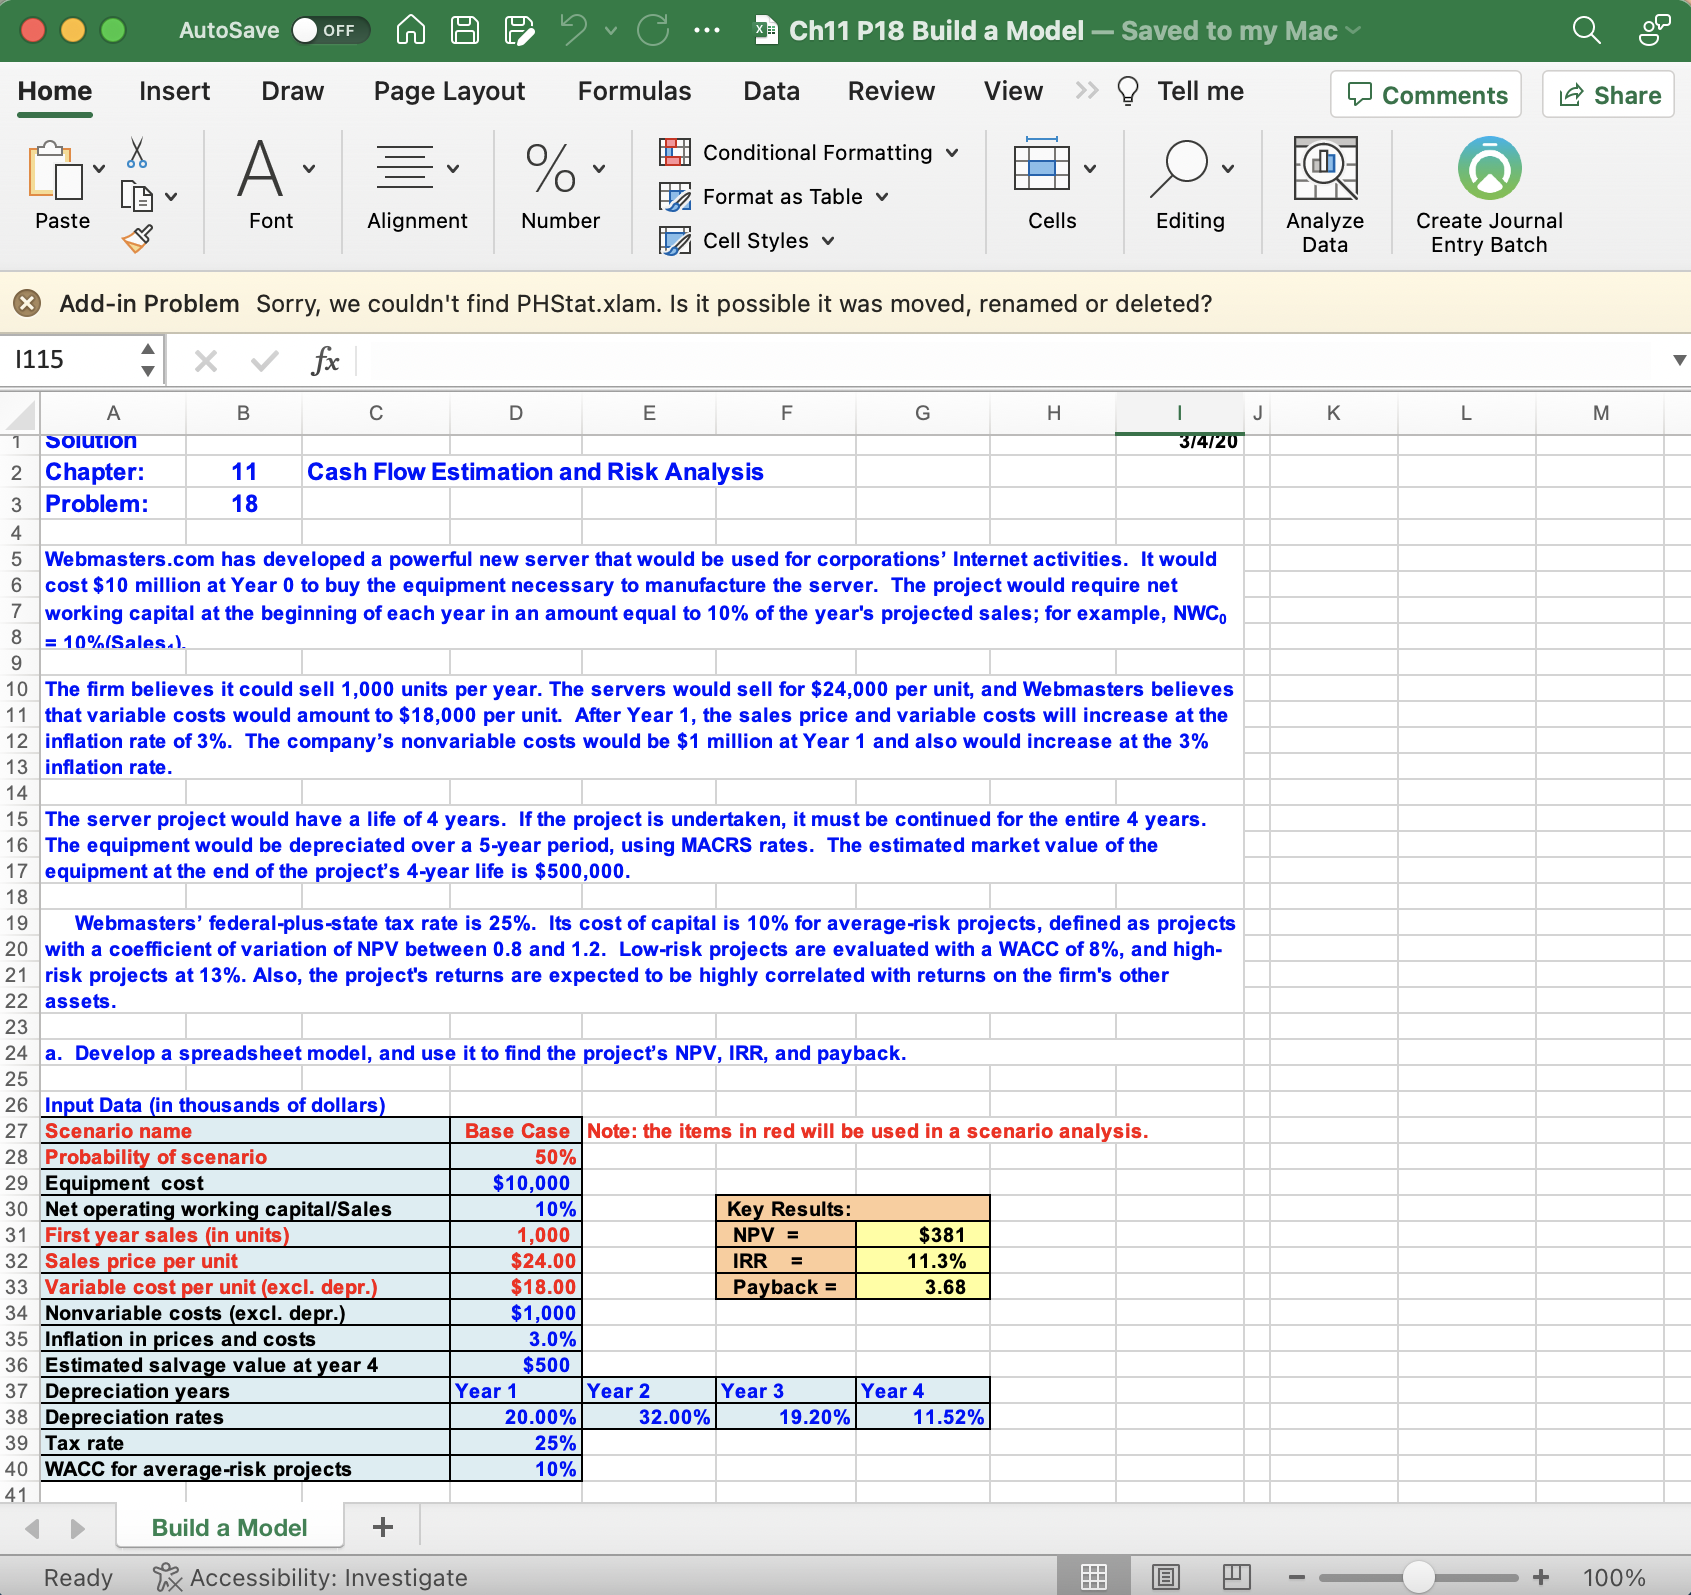
Question: b. Now conduct a sensitivity analysis to determine the sensitivity of NPV to changes in the sales price, variable costs per unit, and number of
b. Now conduct a sensitivity analysis to determine the sensitivity of NPV to changes in the sales price, variable costs per unit, and number of units sold. Set these variables values at 10% and 20% above and below their base-case values. Include a graph in your analysis.
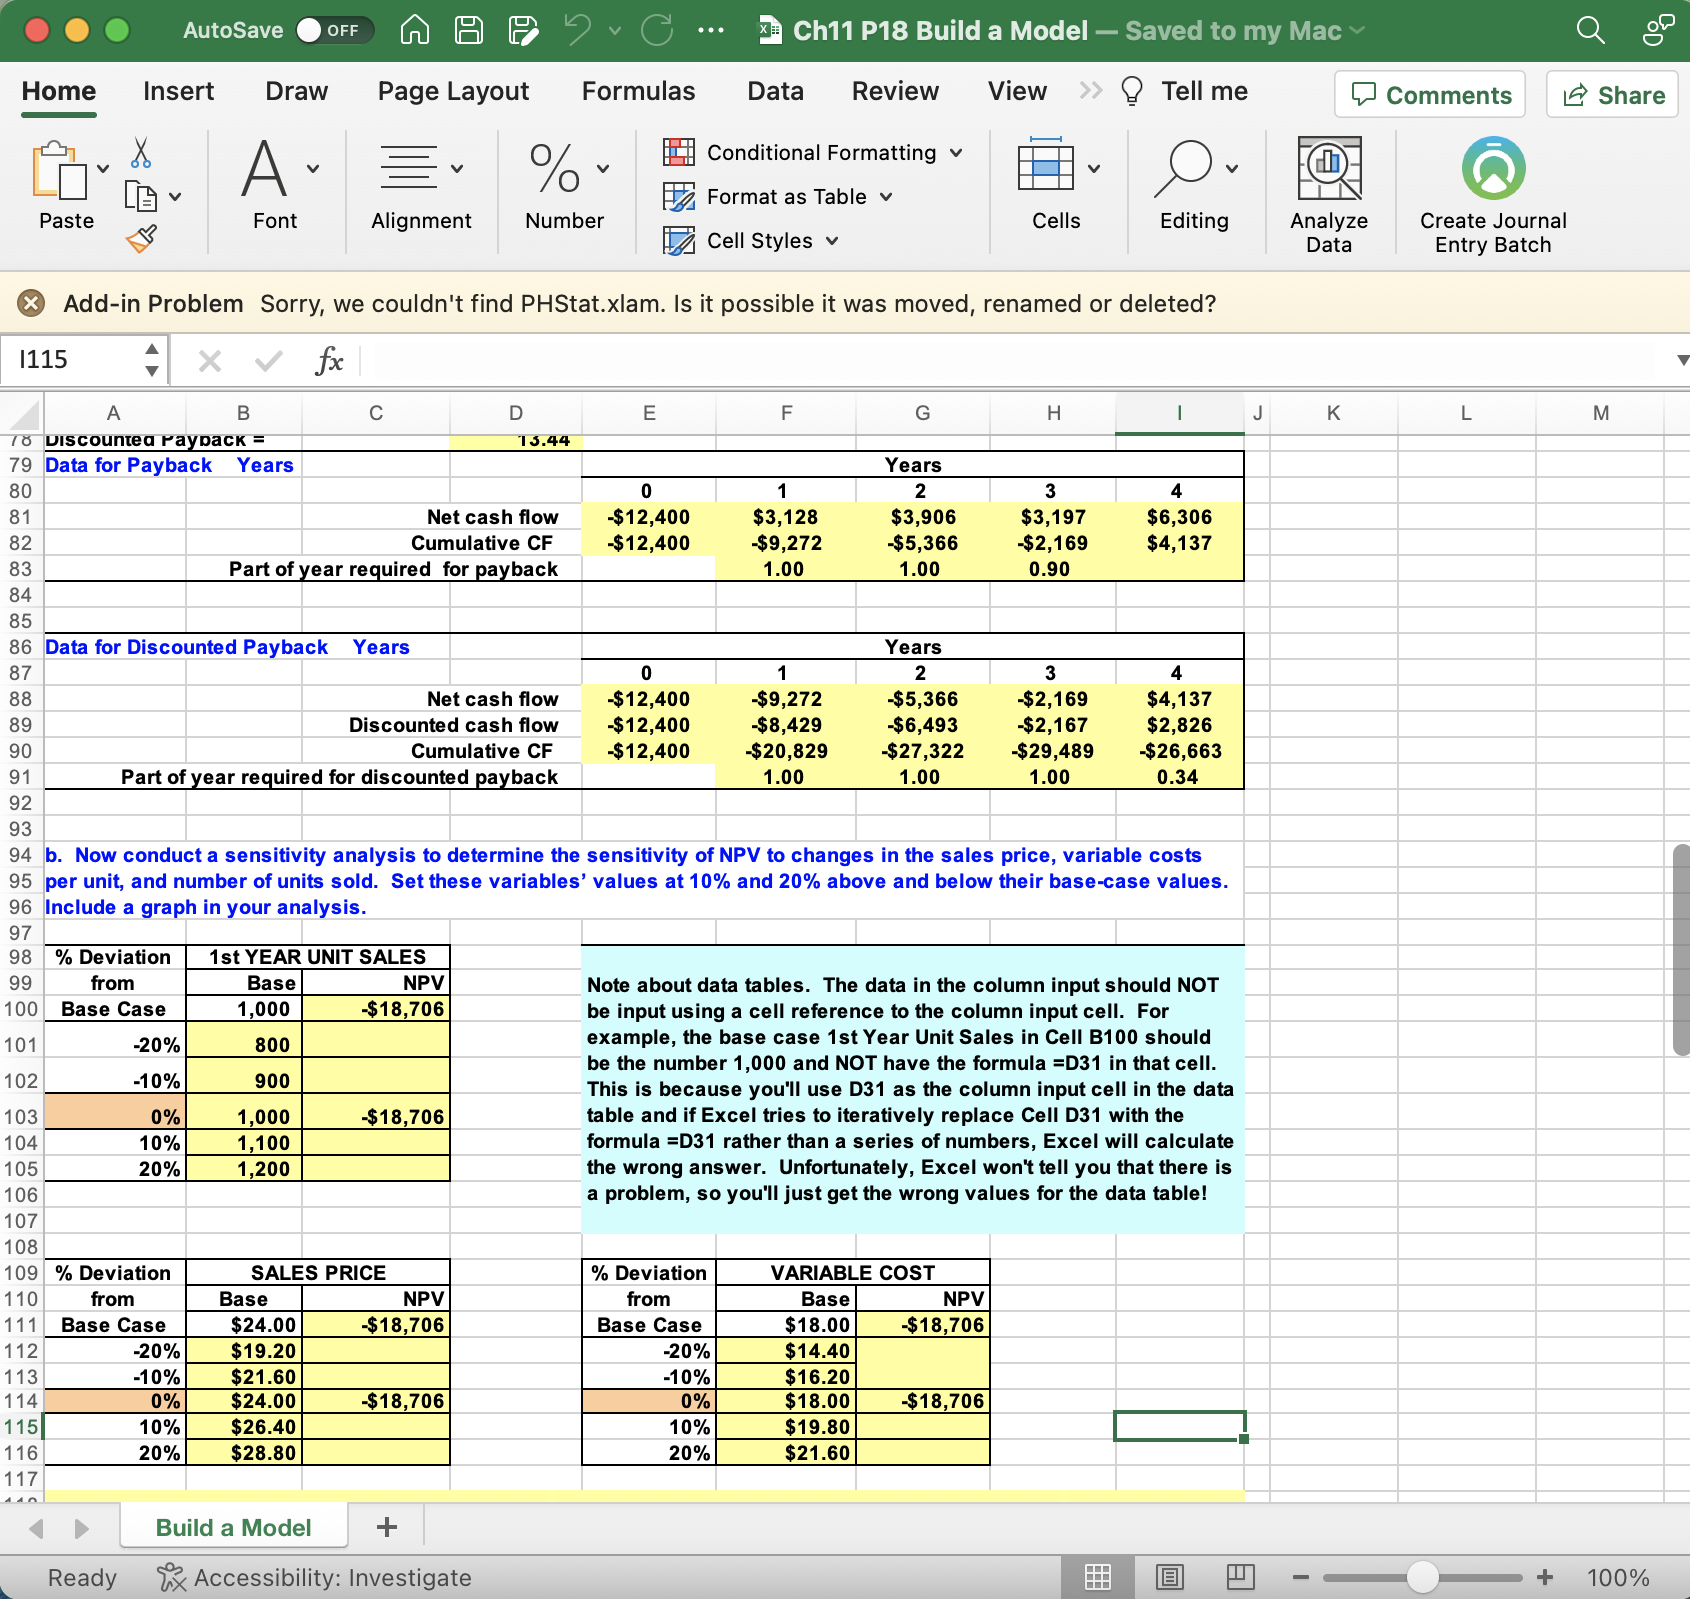
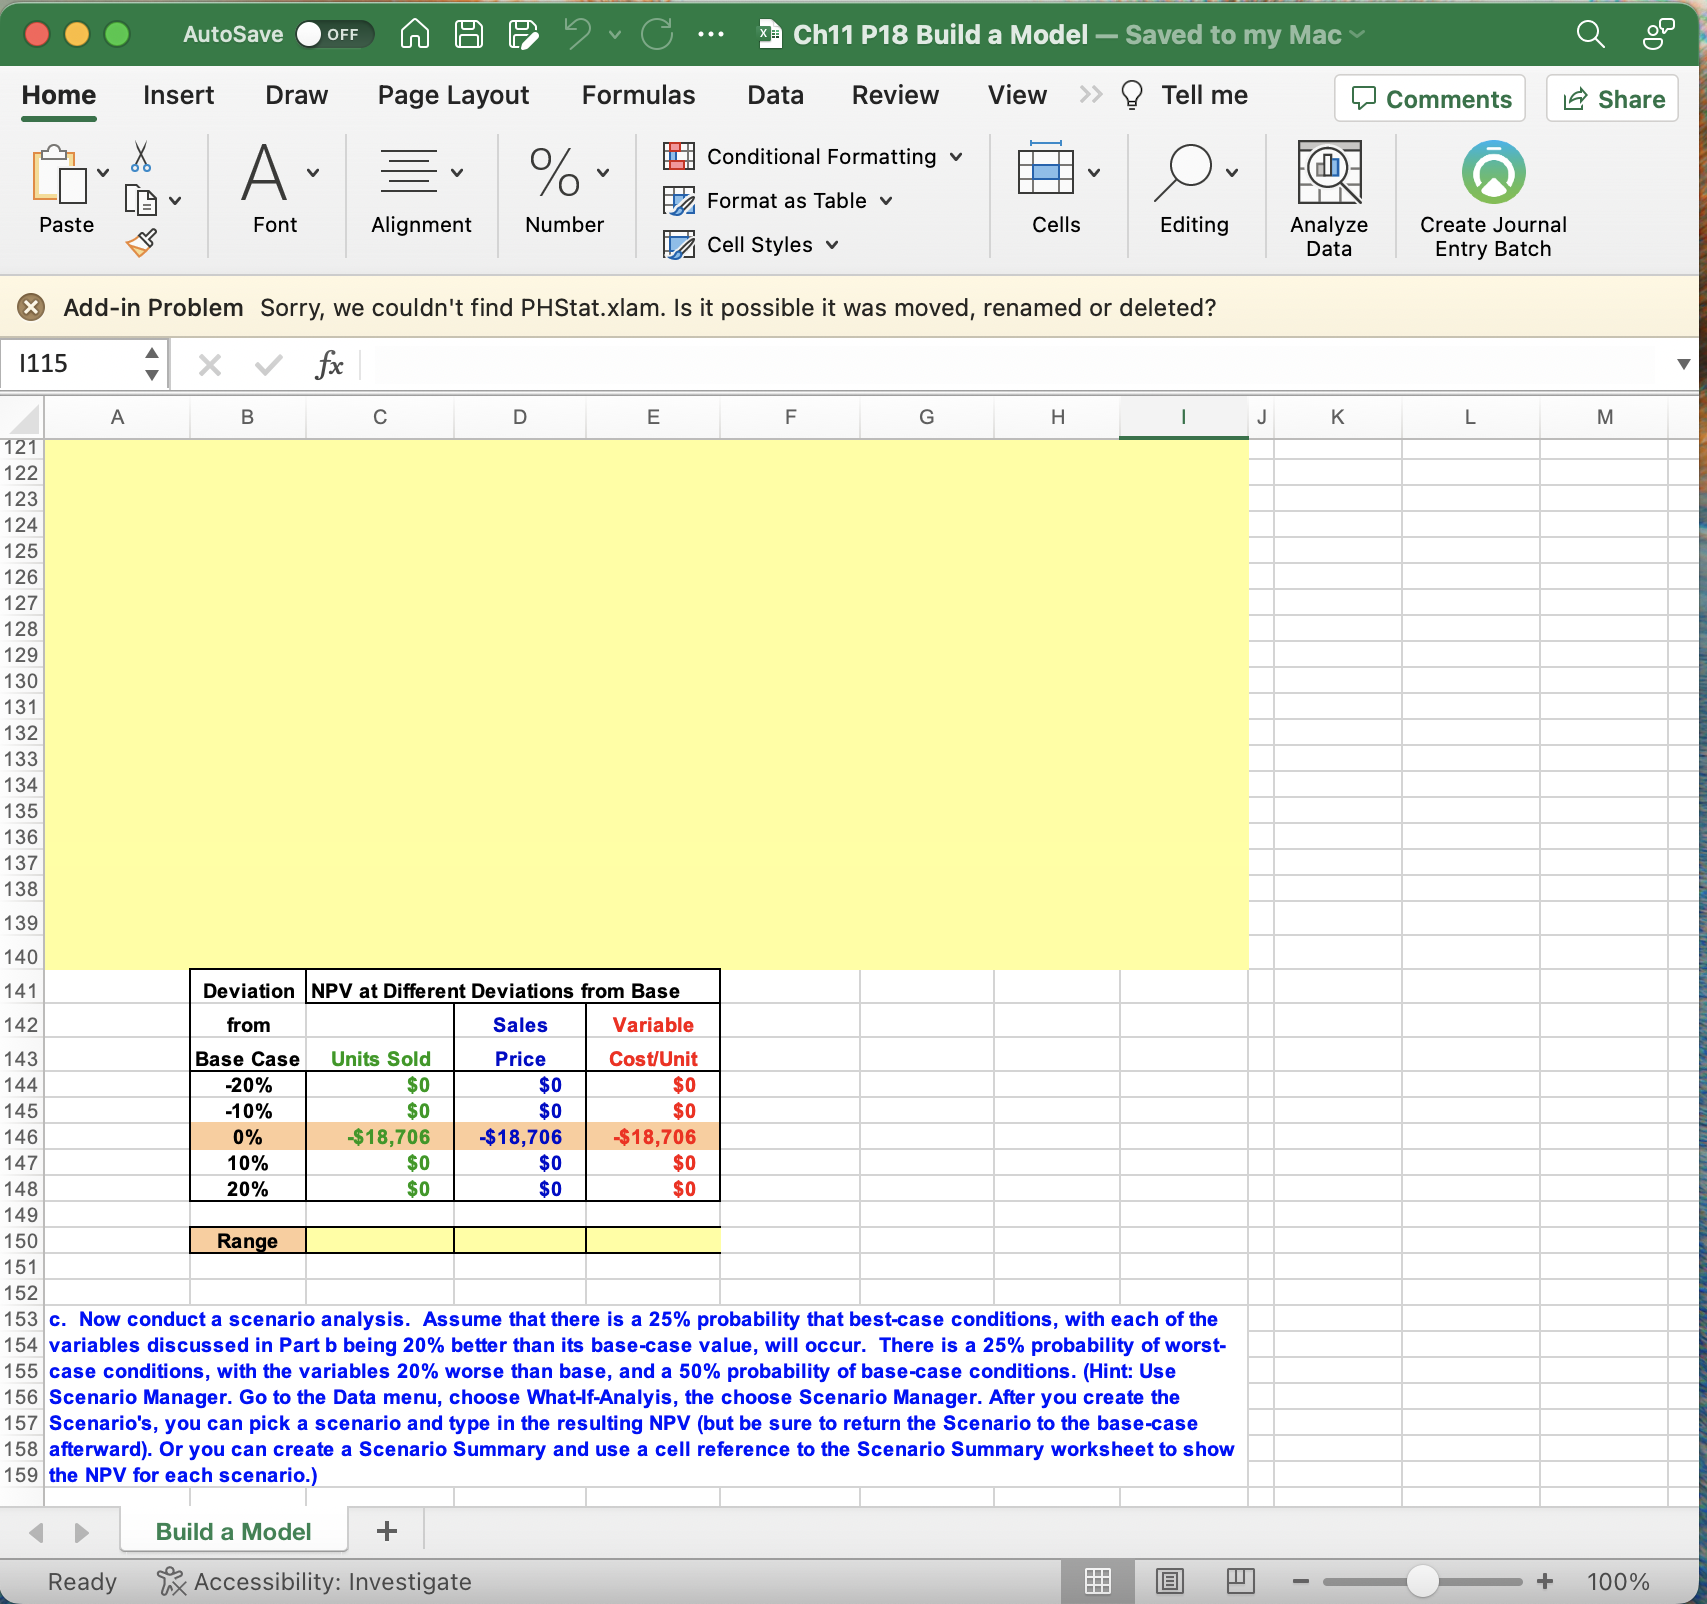
Home Insert Draw Page Layout Formulas Data Review View Tell me Add-in Problem Sorry, we couldn't find PHStat.xlam. Is it possible it was moved, renamed or deleted? ( Add-in Problem Sorry, we couldn't find PHStat.xlam. Is it possible it was moved, renamed or deleted? 94 b. Now conduct a sensitivity analysis to determine the sensitivity of NPV to changes in the sales price, variable costs per unit, and number of units sold. Set these variables' values at 10% and 20% above and below their base-case values. Include a graph in your analysis. Note about data tables. The data in the column input should NOT be input using a cell reference to the column input cell. For example, the base case 1st Year Unit Sales in Cell B100 should be the number 1,000 and NOT have the formula =D31 in that cell. This is because you'll use D31 as the column input cell in the data table and if Excel tries to iteratively replace Cell D31 with the formula =D31 rather than a series of numbers, Excel will calculate the wrong answer. Unfortunately, Excel won't tell you that there is a problem, so you'll just get the wrong values for the data table! AutoSave OFF Insert Draw Page Layout Paste Font Alignment %. Number Formulas Data Review Conditional Formatting v Format as Table v Cell Styles v View Tell me Comments Create Journal Share Entry Batch ( Add-in Problem Sorry, we couldn't find PHStat.xlam. Is it possible it was moved, renamed or deleted? 153 c. Now conduct a scenario analysis. Assume that there is a 25% probability that best-case conditions, with each of the 154 variables discussed in Part b being 20% better than its base-case value, will occur. There is a 25% probability of worst- 155 case conditions, with the variables 20% worse than base, and a 50% probability of base-case conditions. (Hint: Use 156 Scenario Manager. Go to the Data menu, choose What-If-Analyis, the choose Scenario Manager. After you create the 157 Scenario's, you can pick a scenario and type in the resulting NPV (but be sure to return the Scenario to the base-case 158 afterward). Or you can create a Scenario Summary and use a cell reference to the Scenario Summary worksheet to show 159 the NPV for each scenario.) Build a Model Ready ix Accessibility: Investigate Home Insert Draw Page Layout Formulas Data Review View Tell me Add-in Problem Sorry, we couldn't find PHStat.xlam. Is it possible it was moved, renamed or deleted? ( Add-in Problem Sorry, we couldn't find PHStat.xlam. Is it possible it was moved, renamed or deleted? 94 b. Now conduct a sensitivity analysis to determine the sensitivity of NPV to changes in the sales price, variable costs per unit, and number of units sold. Set these variables' values at 10% and 20% above and below their base-case values. Include a graph in your analysis. Note about data tables. The data in the column input should NOT be input using a cell reference to the column input cell. For example, the base case 1st Year Unit Sales in Cell B100 should be the number 1,000 and NOT have the formula =D31 in that cell. This is because you'll use D31 as the column input cell in the data table and if Excel tries to iteratively replace Cell D31 with the formula =D31 rather than a series of numbers, Excel will calculate the wrong answer. Unfortunately, Excel won't tell you that there is a problem, so you'll just get the wrong values for the data table! AutoSave OFF Insert Draw Page Layout Paste Font Alignment %. Number Formulas Data Review Conditional Formatting v Format as Table v Cell Styles v View Tell me Comments Create Journal Share Entry Batch ( Add-in Problem Sorry, we couldn't find PHStat.xlam. Is it possible it was moved, renamed or deleted? 153 c. Now conduct a scenario analysis. Assume that there is a 25% probability that best-case conditions, with each of the 154 variables discussed in Part b being 20% better than its base-case value, will occur. There is a 25% probability of worst- 155 case conditions, with the variables 20% worse than base, and a 50% probability of base-case conditions. (Hint: Use 156 Scenario Manager. Go to the Data menu, choose What-If-Analyis, the choose Scenario Manager. After you create the 157 Scenario's, you can pick a scenario and type in the resulting NPV (but be sure to return the Scenario to the base-case 158 afterward). Or you can create a Scenario Summary and use a cell reference to the Scenario Summary worksheet to show 159 the NPV for each scenario.) Build a Model Ready ix Accessibility: Investigate
Step by Step Solution
There are 3 Steps involved in it

Get step-by-step solutions from verified subject matter experts