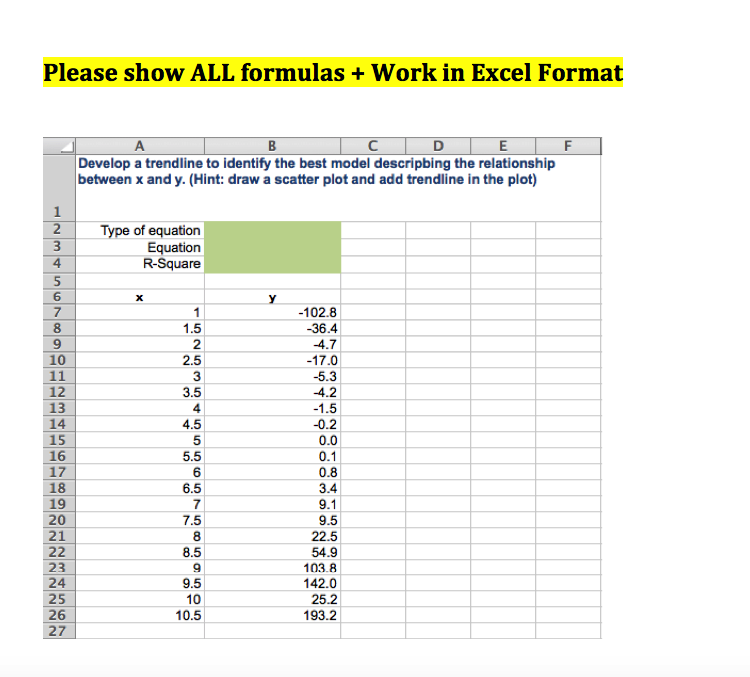
Question: Please show ALL formulas + Work in Excel Format F A B C D E Develop a trendline to identify the best model descripbing the

Please show ALL formulas + Work in Excel Format F

Please show ALL formulas + Work in Excel Format F A B C D E Develop a trendline to identify the best model descripbing the relationship between x and y. (Hint: draw a scatter plot and add trendline in the plot) Type of equation Equation R-Square 1 2 3 4 5 6 7 8 9 10 11 12 13 14 15 16 17 18 19 20 21 22 23 24 25 26 27 1 1.5 2 2.5 3 3.5 4 4.5 o ono -102.8 -36.4 4.7 -17.0 -5.3 4.2 -1.5 -0.2 0.0 0.1 0.8 3.4 9.1 9.5 22.5 54.9 1038 142.0 25.2 193.2 6.5 7 7.5 8 8.5 9 9.5 10 10.5

Step by Step Solution

There are 3 Steps involved in it

1 Expert Approved Answer
Step: 1 Unlock blur-text-image
Question Has Been Solved by an Expert!

Get step-by-step solutions from verified subject matter experts

Step: 2 Unlock
Step: 3 Unlock

Students Have Also Explored These Related General Management Questions!