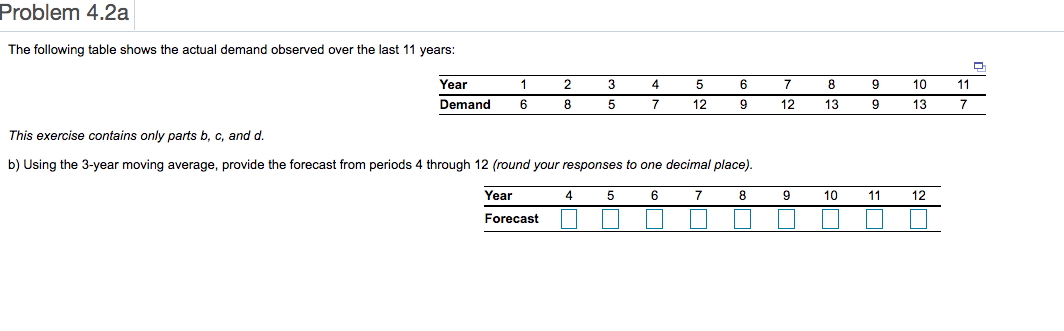
Question: Please show all steps and explain Problem 4.2a The following table shows the actual demand observed over the last 11 years: 1 2 3 4

Please show all steps and explain

Please show all steps and explain Problem 4.2aPlease show all steps and explain Problem 4.2a

Problem 4.2a The following table shows the actual demand observed over the last 11 years: 1 2 3 4 5 6 9 11 Year Demand 7 12 8 13 10 13 6 8 5 7 12 9 9 7 This exercise contains only parts b, c, and d. b) Using the 3-year moving average, provide the forecast from periods 4 through 12 (round your responses to one decimal place). Year 4 5 6 7 8 9 10 11 12 Forecast Problem 4.59 Question Help Sales of tablet computers at Ted Glickman's electronics store in Washington, D.C., over the past 10 weeks are shown in the table below: 1 3 4 5 6 7 8 9 10 Week Demand 2 21 21 27 36 25 28 37 24 26 30 a) The forecast for weeks 2 through 10 using exponential smoothing with a = 0.50 and a week 1 initial forecast of 21.0 are (round your responses to two decimal places): 4 5 6 Week 1 Demand 21 Forecast 21.0 2 21 3 27 7 37 25 8 24 9 26 10 30 36 28

Step by Step Solution

There are 3 Steps involved in it

1 Expert Approved Answer
Step: 1 Unlock blur-text-image
Question Has Been Solved by an Expert!

Get step-by-step solutions from verified subject matter experts

Step: 2 Unlock
Step: 3 Unlock

Students Have Also Explored These Related General Management Questions!